With all the component and configuration options for constructing and managing a small network, it is important to numerically evaluate network performance. Performance measurements provide facts and statistics about the amount of data on your network and identify opportunities for improvement. Without measuring performance, the only indications of functionality are simple up and down states, as well as subjective statements based on user experience.
To manage any network over a period of time, it is useful to measure normal activity, as well as high and low traffic activity. Good network management involves metric based information on the volumes of traffic and various component performance levels. This is often referred to as "baselining" your network and establishing network benchmarks.
Even for the smallest network, a best practice while working to improve the network is to measure before and after performance of the network to objectively evaluate the value of the actions. Of course, there are many fee-based products that provide solutions for measuring and managing a network. Fortunately for the small network administrator, there are also free, yet powerful tools available to measure network performance.
In my next several posts, I’m going to review several network measurement tools which are generally available as free downloads. Specifically, we’ll take a look at NetMeter, Qcheck, and Iperf/Jperf and discuss basic uses. (I’m open to covering a others, as well, feel free to post suggestions via the Comments.)
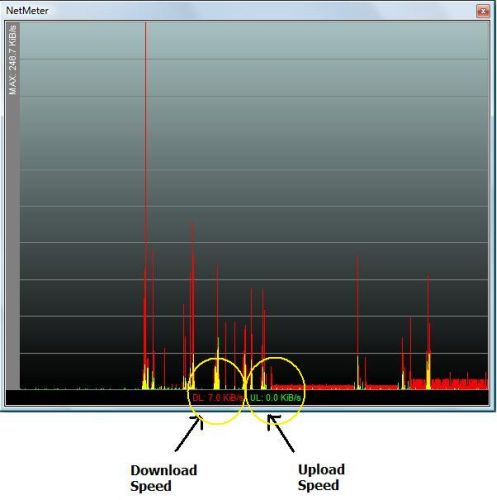
The majority of network traffic is generated by end devices, so it is useful to start with a tool that can help measure the network activity on a PC such as NetMeter. NetMeter is a nice graphical tool for monitoring, tracking and displaying bidirectional network activity on a PC. As you can see from Figure 1, I have NetMeter running on my Vista laptop providing a continuous display of both Download (DL) and Upload (UL) data rates.

Figure 1: NetMeter Display
The program is a small 600 KB file and installs in a few seconds. Once installed, NetMeter can be configured to run on startup, or can be selected from the start menu and turned on and off as desired. NetMeter runs in a resizable window that sits on top of other windows, but can be minimized or configured in a transparent mode, similar to the transparent functionality of Windows Vista.
NetMeter’s default configuration measures throughput in units of KiB/s and MiB/, which are kilo-bytes/second and mega-bytes/second. Typically, bandwidth is measured in bits/second, but either bytes or bits are acceptable, as long as you recognize which units the tool is using, and normalize your metrics when comparing measurements between tools.
Conveniently, NetMeter can be reconfigured to different units, including bits/second. It is interesting to simultaneously run a web-based ISP speed test, such as speakeasy.net, and see the NetMeter real-time graph track to the web-based tool.
One weakness is that the graphical chart has few configuration options. The chart can be configured to auto-scale to network activity levels, and you can specify the bandwidth per interface, but the time/x-axis can’t be configured, making inspection of details at specific points in time challenging.
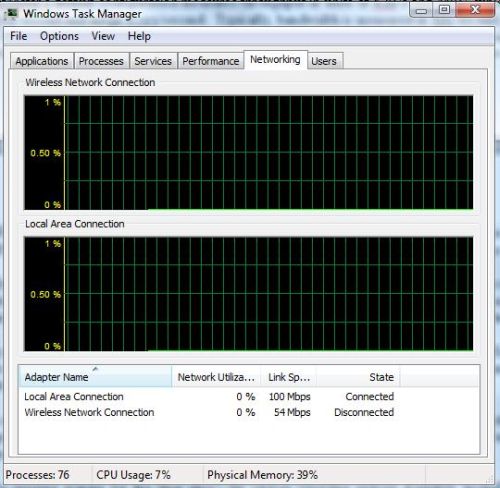
Windows Task Manager (Figure 2) can also be used to look at network performance as it relates to interfaces. Note, though, that Task Manager is only showing a percentage of utilization based on the maximum throughput capability of the interface, which may not translate into actual throughput.

Figure 2: Windows Task Manager – Network Performance
There are multiple uses for NetMeter. If you’re running an application on your network and curious about the amount of traffic generated by the application, NetMeter can provide a real time view of the traffic being sent and received between the application and the server.
In addition to the graphical display, NetMeter provides numerous tracking and alert options. The reporting capability can be very handy to measure individual end user PC activity or for measuring usage with a usage sensitive ISP connection.
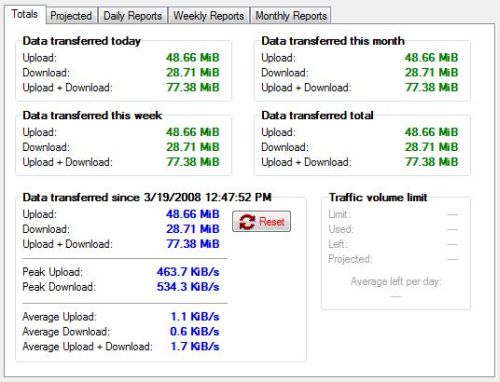
Figure 3 shows the various reporting options available, including daily, weekly, and monthly download and upload data transfer volumes. These reports can be exported to a csv file for use in a spreadsheet or other analysis tool. Further, NetMeter also offers the ability to track ongoing bandwidth use and provide alerts on upload, download or combined utilization based on a user defined threshold of daily, weekly or monthly values.

Figure 3: NetMeter Reporting
I’m impressed with this simple tool. NetMeter displays continuous network throughput as opposed to batch tools, like Qcheck or Iperf, and is interesting to use while connecting to multimedia flows. For example, I found it interesting to observe the continuous network throughput on my wireless interface while writing this blog and listening to an NHL game broadcast over the Internet. (The Red Wings won!)
NetMeter successfully monitored utilization over my laptop’s wired and wireless interfaces, as well as an SSL VPN connection to my home network. I left it in default configuration to monitor all interfaces, but could have set it to monitor a specific interface as well.
I recommend you give NetMeter a shot, it is a good start to network monitoring and a tool a small network administrator will find handy on their laptop. And if you really like it and use it regularly, don’t forget to make a PayPay donation.
