More Workstation
The last installment provided details for building your own 10GbE workstation capable of reaching 750 MB/s transfer rates. For my last post of this series, I’ll discuss the workstation build a bit more, then move on to a beefier server configuration.
First, here’s the component diagram for the ASUS Z87-WS motherboard I use in my own editing workstation. It has two 1 GbE network ports and sufficient PCIe bandwidth for two SLI-capable video cards, while running a single-port 10GbE network card.

ASUS Z87-WS motherboard
At the upper end of the workstation motherboard range, the ASUS P9X79-WS workstation uses a socket 2011 configuration to provide both more lanes of PCIe bandwidth and significantly more memory capacity. If you are looking to build a serious editing workstation/server with two video cards, a RAID card, and dual port 10GbE card, all running simultaneously, this board would be required to ensure sufficient PCIe bandwidth.

ASUS P9X79-WS motherboard
Benchmarks
The Asus Z87-WS workstation I used for Adobe Premiere CC (current as of January 2014) network tests generated some very respectable numbers using the Adobe Premiere Pro Benchmark for CS5 (PPBM5) and Premiere Pro Benchmark for CS6 (PPBM6). Bill Gehrke and Harm Millaard maintain these benchmarks in an attempt to assist editors in building cost-effective editing workstations. You can download the older test series at http://ppbm5.com/Instructions.html or the newer (takes longer to run) version at http://ppbm7.com/index.php/homepage/instructions
This benchmark numbers for the older PPBM5.5 tests are generated during the render and output of three timelines, pictured below:

PPBM5.5 benchmark
I’ve updated the PPBM5.5 tests shown earlier in this series with more tests, including top 10 average results for the highest scoring online submissions. For these tests, the project, source files, cache files and preview files were all in the same directory on the local drive, NAS, or Server to reflect a completely shared network solution. The results, using various local drives and network shares, are summarized in Table 1.
|
Target Disk |
Disk I/0 Test (seconds) |
Mpeg2-DVD encode (seconds) |
H.264 Encode (seconds) |
MPE (mercury engine enabled, seconds) |
|---|---|---|---|---|
|
Local 500GB SATA3 SSD Samsung Evo with RAPID enabled |
29 |
41 |
49 |
4 |
|
TS-470 Pro 10GbE, Intel 530 SSD x 4, 1 TB, RAID 0 |
35 |
42 |
52 |
4 |
|
Windows 2012 Server R2, 10GbE, RocketRaid 2720, 24TB, 6 x 4TB Hitachi 7200 disks, RAID 5 |
39 |
43 |
49 |
4 |
|
TS-470 Pro 10GbE, 16TB, 4 x 4TB Hitachi 7200, RAID 0 |
54 |
43 |
51 |
5 |
|
Local WD Black 2TB 7200 HD |
84 |
40 |
49 |
5 |
|
5 year old TS-509 Pro, 1GbE, 5TB, 5 x 1TB 5400, RAID5 |
263 (Yikes!) |
80 |
53 |
7 |
|
Average Top 10 of 1351 results posted: http://ppbm5.com/DB-PPBM5-2.php |
55 |
31 |
40 |
4.5 |
Table 1: PPBM5.5 Test Results
From these results, you can see that the 2012 Windows Server with a six disk RAID 5 array (third down) performed almost as well over 10GbE as did the locally-connected Samsung Evo SSD with RAPID RAM caching enabled (first entry). In other words, the 10GbE network drive was almost as fast as the very latest SSD technology connected directly to the motherboard, but with 40X the capacity.
Expand the Server’s RAID array to eight or more drives and the 10GbE results could easily surpass a locally-connected SSD, which is limited by SATA3 to around 500 MB/s.
The importance of these benchmarks is that they use real video files in various time lines to offer real-world comparative benchmarks. The 1 GbE results (sixth down) should reveal why editing over older 1 GbE links is not recommended. If you are doing a lot of rendered finished output and time is critical, a more powerful Nvidia like the GTX 780 would reduce all of the rendering times I’ve posted significantly.
Server Build
The parts list for the server build is shown in Table 2. Note this does not include Windows 2012 Server Essentials or Windows 8.1 x64 license.
| Component | Description | Price |
|---|---|---|
| Case | Corsair Obsidian 550D | $150 |
| Motherboard | Supermicro X9SRH-7FT ATX (10GbE Intel X540 dual port onboard) |
$520 |
| CPU | Intel E5-2620 v2 @ 2.10GHz – 6 Core LGA2011 15MB Cache | $500 |
| CPU Cooler | HH-U12DX i4 CPU cooler | $80 |
| Memory | 8GB Module DDR3 1600MHz ECC CL11 RDIMM Server Premier (x4) | $290 |
| RAID Controller | RocketRaid 2720 SGL | $154 |
| RAID Cables | CABLE 3WARE – CBL-SFF8087OCF-05M (x6) | $24 |
| Boot SSD | Intel 530 120 GB | $99 |
| Hard Drives | 24 TB RAID 5 Array – Hitachi Deskstar NAS 4 TB (x6) | $1400 |
| Power Supply | Corsair 750w Bronze (750 W) | $89 |
| Total | $3306 | |
Table 2: 10GbE Workstation parts
If you’re just sharing 10GbE storage for two workstations, you could simply purchase a dual-port 10GbE card for your server and directly connect the workstations. The rest of your network could access your server via existing 1 GbE infrastructure, connected to an inexpensive 1 GbE NIC (I’ve added an older dual port 1 GbE Intel card in the Cinevate server build). The Supermicro X9SRH-7TF board can handle two PCIe x 8 cards. So add another two dual-port 10GbE cards and up to six workstations could be directly-connected via 10GbE.
Alternatively, I produced some very high performance numbers substituting the cheaper ASUS Z87-A board in the “server build” using just Windows 8.1 as the operating system. A small shop with only two editing workstations might just build an Adobe CC workstation/server in the Obsidian 550D case, add six to eight hard drives, a single port 10GbE card and share the RAID array with the second workstation by directly connecting the 10GbE cards. In this case, one workstation would double as the server.
Consider that a NAS like the QNAP TS-870 Pro with the same six 4 TB drives (with room for 2 more) and 10GbE interface would total approximately $3500, with no server license costs. You can see there is a business case to just use a NAS, if all you need is file storage or if you already have a server on site.
The SuperMicro board I used is somewhat unique in the market right now for several reasons:
1. Supermicro has integrated dual Intel X540 10GbE ports. The price of the entire board is less than a 2 port Intel 10GbE card!
2. It is an ATX format server board, so it is easy to find cases to fit.
3. The X9SRH-7TF is a single CPU board, supporting 22nm Xeon processors, so power consumption is much less than a dual CPU server board.
4. A third network port provides out-of-band management (IPMI) meaning full access to the server (even during startup), and the ability to set thresholds and receive emails if, say, a chassis fan fails. This is all done using a remote Java -nabled web browser. Very cool.
5. It supports a lot of RAM, so a MacOS-only shop needing an Adobe CC workstation could potentially run it via a virtual machine on the server, accessible to any network Mac. Virtual machines are used increasingly to run multiple servers and operating systems simultaneously, using just one box.
6. The board hosts 10 x SATA3 ports, as well as 4 x SATA2 ports onboard. For those looking at an Ubuntu server build, i.e. free server software and a ZFS RAID array, this Supermicro board is ideal.
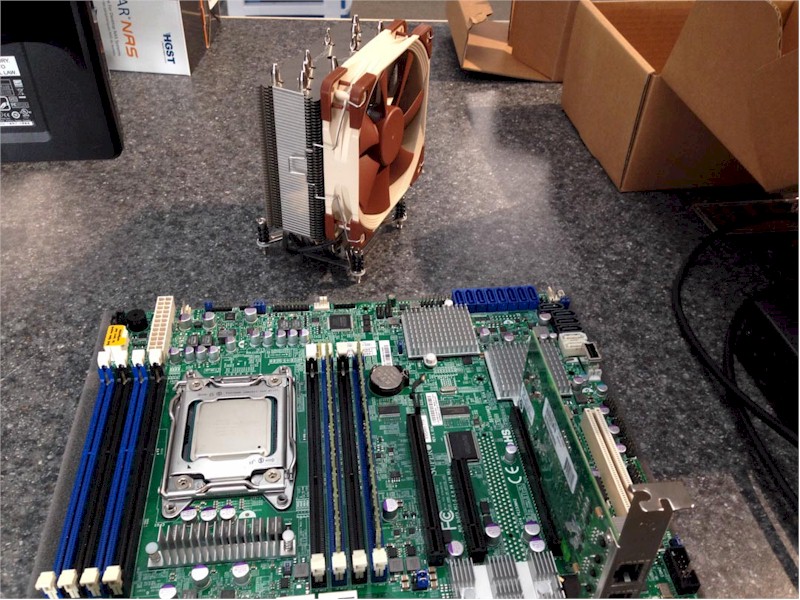
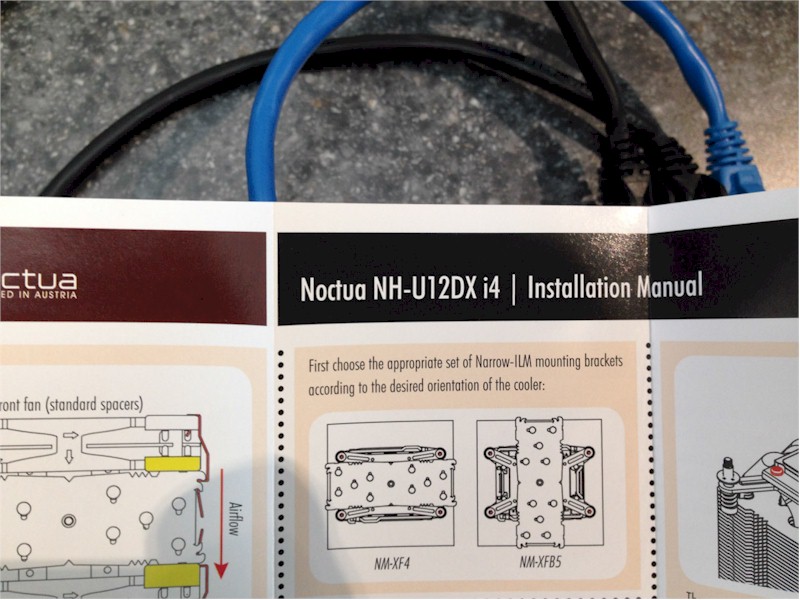
The Supermicro board has video and 10GbE on board. So all you need to get started is RAM, CPU, CPU cooler and boot drive. Note that this board requires a narrow ILM bolt pattern heat sink, which differs from the typical square pattern used for Xeon processors. The narrow version requires less space on the motherboard. Noctua’s NH-U9DX i4 cooler is excellent and includes all the parts needed for various configurations.
You’ll see in the gallery pictures that these Xeon heatsinks attach using screws, instead of the typical spring-loaded plastic push pins. The Xeon 22nm CPUs differ from typical i5 or i7 processors in that they use the socket 2011 standard, so more “lanes” of bandwidth to the chip are provided. This means more PCIe x16 and/or x8 slots, as well as higher RAM capacity. Xeon CPUs don’t include Intel HD graphics, so tend to be bit less expensive as well.
Click through the gallery for a look at all the parts and the finished assembly.
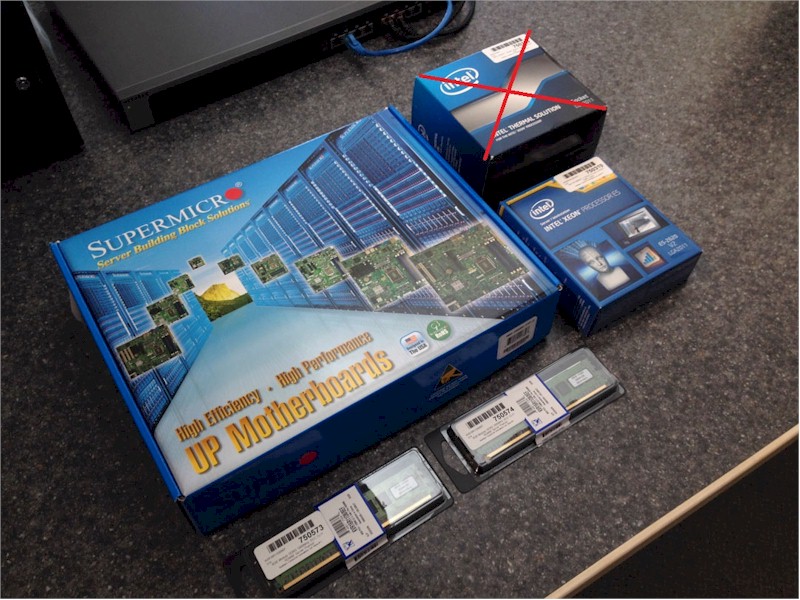
Group shot of the boxes for the Supermicro motherboard, Intel Xeon CPU and ECC RAM
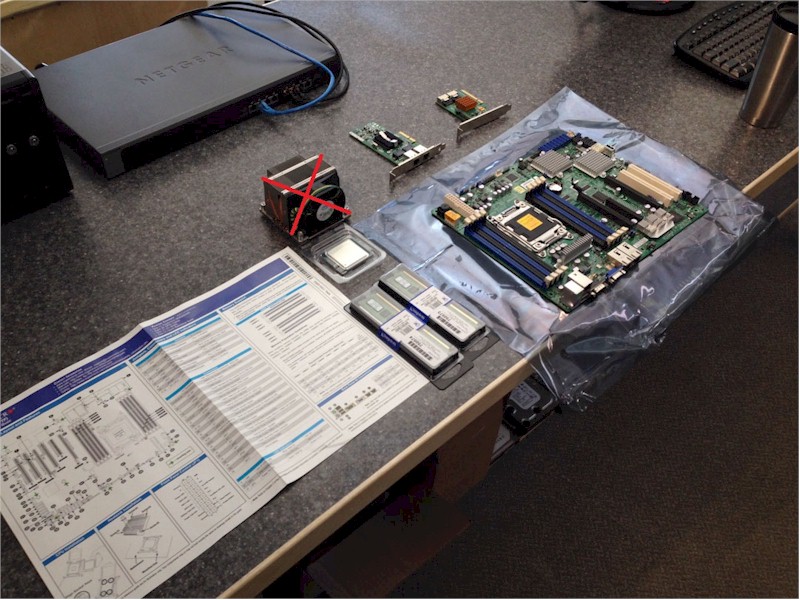
The above parts out of their boxes. Note the stock Intel cooler is not used
Noctua NH-U9DX i4 CPU cooler
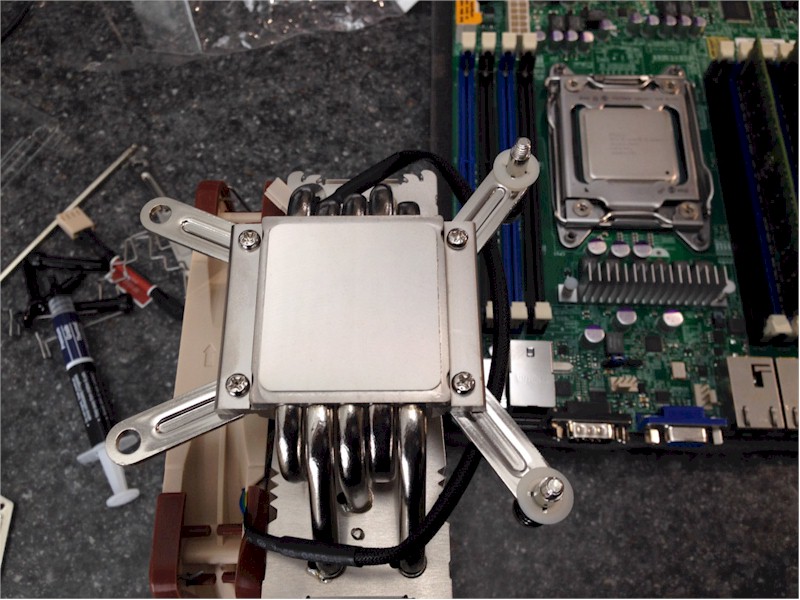
Noctua cooler shown upside down, in the process of being converted from square, to narrow ILM bolt pattern. Noctua’s highly regarded heat sink compound is included in the package, as well as instructions for application. Proper application of heat sink paste is required to ensure the CPU transfers heat to the CPU cooler efficiently.
You will want to orient the CPU cooler in the best position for your setup. In this case, the warm air from the CPU cooler is directed toward the rear exhaust fan.
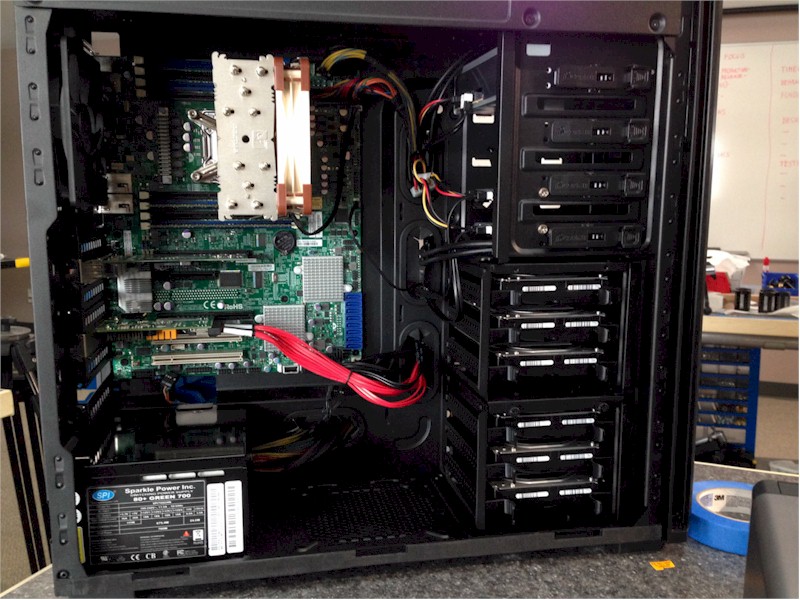
A very clean build with good airflow. The Intel X540 10GbE chips are hiding under the two aluminum motherboard heat sinks visible lower right. They run quite warm, as does the RocketRaid 2720 card. Good airflow over both is a good idea.
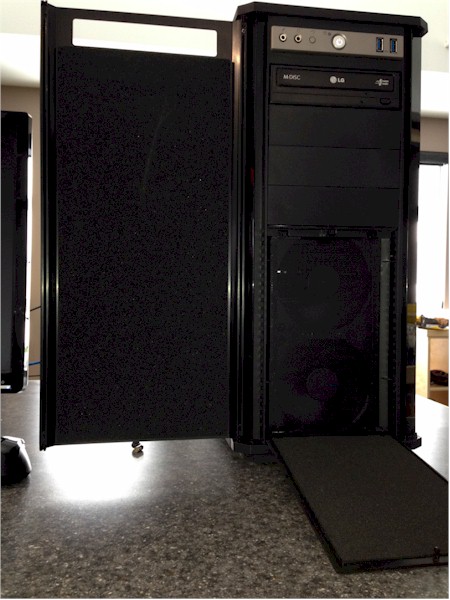
Airflow is noticeably better with the 550D case front doors open, or removed. The two front fans are hiding behind the lower removable lower panel. A removable magnetic screen filters dust and is easily removed for cleaning.
Here’s a screen grab of the IPMI interface, accessed using a web browser via a dedicated 1 GbE port on the Supermicro board.

Supermicro motherboard IPMI interface
Performance
What kind of performance will this server provide? Here’s the ATTO Disk Benchmark. See the notes in the screenshot for test details.

10GbE Server ATTO benchmark
And here are the Intel NASPT results. Again, test details are in the screenshot comment box.
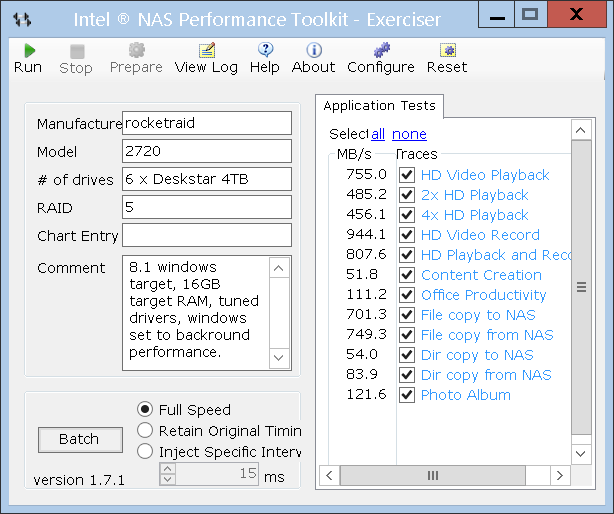
10GbE Server Intel NASPT benchmark
Here’s a Windows 8.1 copy and paste over 10GbE from Raid 5 array (6 x 4TB Hitachi 7200 rpm)

10GbE Server Windows 8.1 filecopy
Closing Thoughts
So there you have it. I hope you’ve found this series as much fun to read as I had researching, testing and writing it! Cinevate’s 10GbE transition is well under way, as the 2012 Server and two 10GbE NASes replace their older counterparts. Our next product launch coming later this month (April 2014) will take advantage of the new high-speed collaborative workflow.
 Dennis Wood is Cinevate’s CEO, CTO, as well as Chief Cook and Bottle Washer. When not designing products, he’s likely napping quietly in the LAN closet.