Introduction
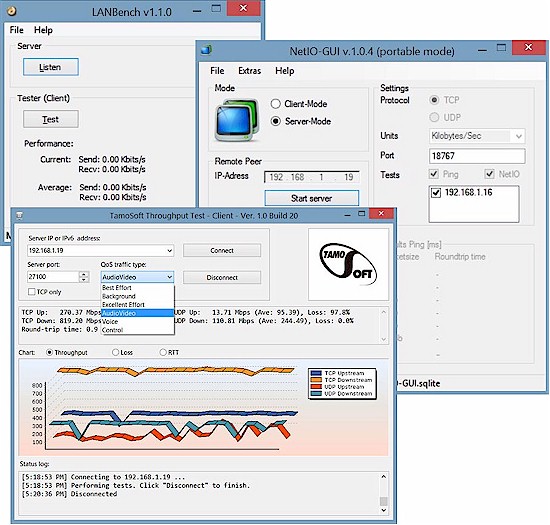
Do you know how fast your network is? Did you just upgrade to Gigabit Ethernet and are curious just how much faster it is than 100 Mbps? What kind of performance are you getting out of your new “AC” router? Are you really getting enough performance out of your powerline network to support HD video streaming? To answer these questions, you need a program that will measure network performance.
We are fortunate to be able to use the “gold standard” of network performance testing tools, Ixia’s IxChariot. It can be a bit intimidating to set up and use, not to mention its very hefty price tag. The good news is that there are a number of performance testing tools that are extremely easy to use and carry the ultimate budget-friendly price – FREE!
Three years ago, we looked at five tools that you can use to measure network speed. That article has been so popular that it prompted this encore, covering three additional free tools that you can add your network utility toolkit.
Each of the three products is based on using one computer as a “server” and a second computer as a client. The client computer is the one that you use to initiate the tests and the one where you harvest the results. For the tests that I ran, I used two nearly new (2 week old) ASUS Intel i7-based notebooks with Gigabit LAN ports. Both computers ran Windows 8.1 and had minimal software installed other than Office, Norton Internet Security and Firefox. Both were connected via a TP-Link 8 port Gigabit switch.
LANBench
First up is LANBench. The current version is 1.1.0 and you can download it here. It is designed as a simple TCP network benchmark utility, so UDP is not supported. From their website, here’s a quick feature summary:
- Freeware
- Multiple simultaneous connections – up to 20 (for load simulation)
- Low CPU overhead for pure network performance test
- Multithreaded utilizing Windows I/O completion port
- Configurable packet size, test duration and transfer mode
LANBench requires almost no setup. Download the zip file, extract the files into a directory, and launch LANBench.exe on both computers that you will be using for your tests. No other installation is required. The screen below will appear:
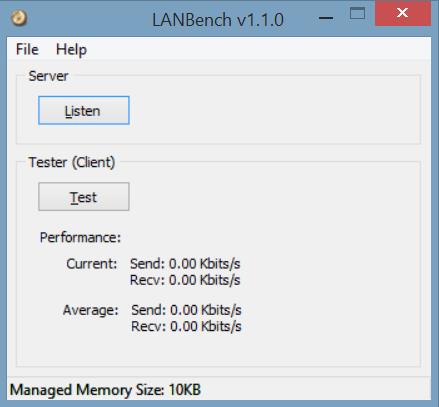
LANBench main screen
On the computer that you choose to use as a server, click on Listen. Be sure to note the IP address of this computer (Run->Cmd->ipconfig), as you will need to enter it into the client computer.
On the client computer, from the File menu, choose Configure and you’ll see the screen below. Enter the IP address of the server, configure your test settings and click OK.
You can test with up to 20 connections. However, in my tests with 20 connections, the tests took an average of 31 seconds to run to completion – even though the test duration was set to 10 seconds. Your results appear on the main screen and are reported in Kbps.
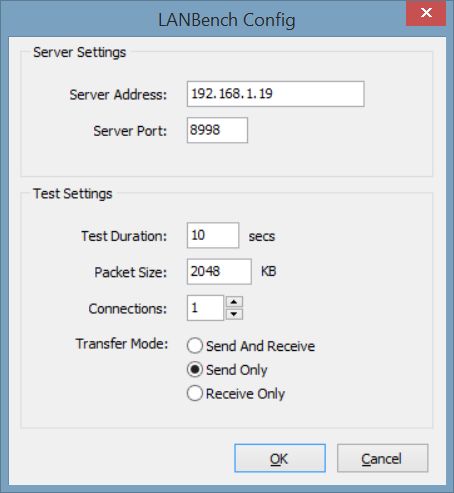
LANBench client configuration
I ran the default test (10 sec, 2048 KB Packet Size and 1 connection) five times for each of the transfer modes. For unidirectional tests, ie, send only or receive only, the results were fairly consistent. A much greater variation was seen when running bidirectional tests with the client computer receiving significantly more traffic than sending. When I switched the client/server pairs the results switched, as well. Table 1 shows one set of results. Note the fairly small standard deviation of the unidirectional tests as compared the the large standard deviation for the bidirectional test.
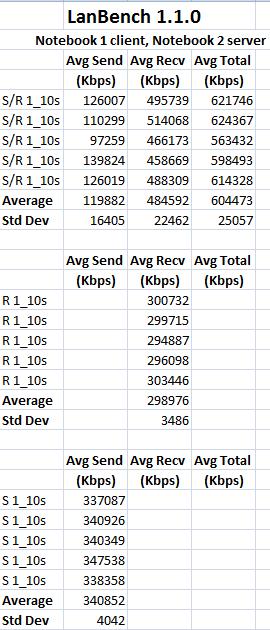
LANBench test results
NetIO-GUI
NetIO-GUI is a graphical version of the command line utility netio. According to the website, NetIO-GUI is an automated test that tests ICMP response times as well as network throughput for different packet sizes and protocols. The results are stored in a SQLite database, and you can easily export the results for analysis in Excel. You can download it here.
Like LANBench, you download the file, unzip it and run the executable. (NetIO-GUI.exe).
Run the executable on both test computers. On the server you designate as the server, click on Server Mode and then Start Server. Note your local IP address in the box on the right-hand side of the screen – you’ll need that to configure the client on the second computer.
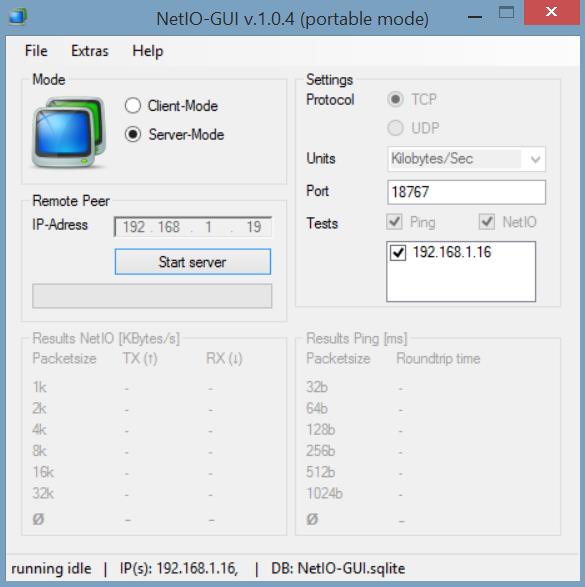
NetIO-GUI – Server Setup
Next, configure the client. In the Remote Peer field, enter in the IP address of the Server computer. Select the tests and protocols that you want to run, select Unit of measure (the default is KBytes/s) and click Start measure. Other options are available in the unit dropdown box. It would be nice if those options included Kilobits/Sec, etc. to make it comparable with other programs.
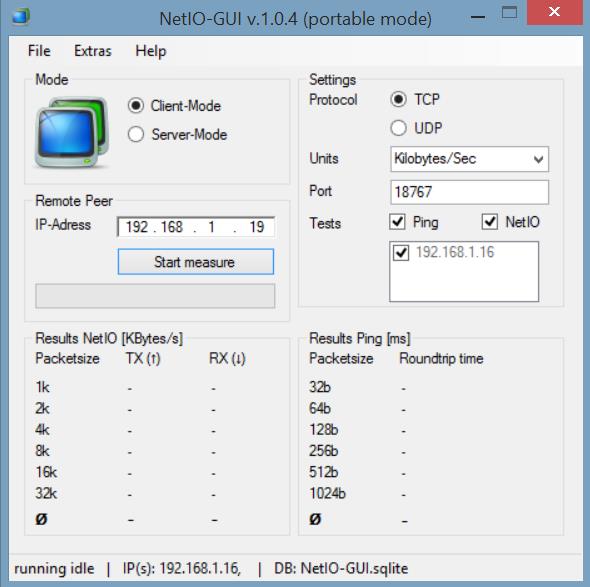
NetIO-GUI Client Setup
The screenshot below shows the results.
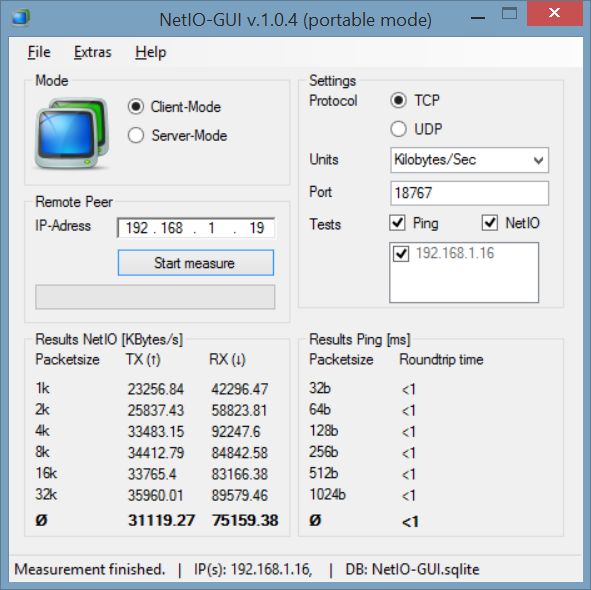
NetIO-GUI results
While you can run separate tests for TCP and UDP, unfortunately there doesn’t appear to be a way to run unidirectional tests. Still, however, if you compare the TX and RX results, you can see that there’s a similar imbalance between send and receive that the LANBench tests also detected. In this case, the same client seems to have significantly better receive performance than send performance.
I like that NetIO-GUI stores its results in an easily accessible database. With LANBench, you had to write down each result and then enter it into a database or spreadsheet. The screenshot below shows the SQL table for four test runs. The data is stored in the table in Bytes/Sec.

NetIO-GUI SQL Table
TamoSoft Throughput Test
TamoSoft is a New Zealand-based company that develops security and network monitoring and analysis tools. Their product line includes LAN and Wi-Fi products ranging in price from $39.00 to $1599.00. Fortunately, they also publish the TamoSoft Throughput Test that you can download free.
Unlike the previous two programs that can be run directly from the executables, TamoSoft Throughput has a setup program that installs the software on your computers. Two separate icons are created: Run Server and Run Client. When you launch the server, your only option, other than changing the default port, is IPv4 or IPv6. It does identify the IP address for the server so that you can easily configure the client.
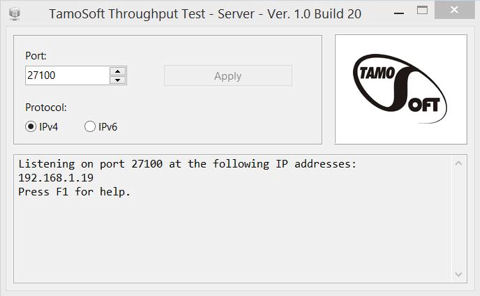
Tamosoft Server
You configure the client with the IP address of the server. Your options include a choice of QoS traffic type, TCP only (no UDP traffic will be generated), and the type chart you want to view. Click Connect to start the test. The image below shows that both TCP and UDP traffic were being generated and the AudioVideo profile was selected.
As with the other two products tested, this plot shows that there’s a significant difference between both TCP and UDP upstream as compared to downstream traffic. It also shows almost 100% UDP upstream packet loss.
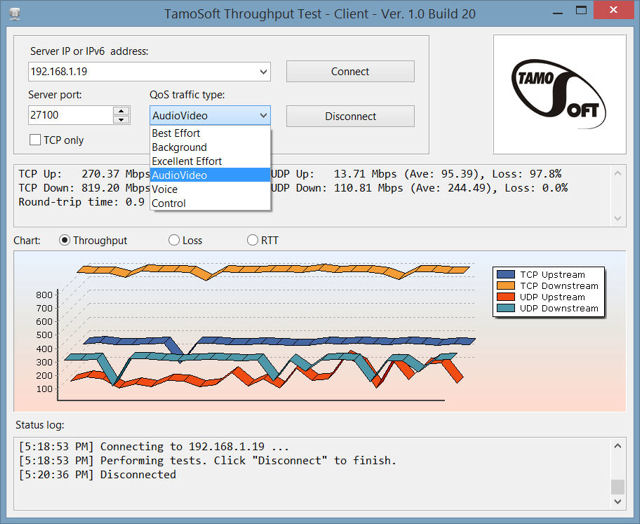
TamoSoft Throughput – UDP and TCP traffic
Clicking on the Loss chart type yields the chart below. Again, this chart reflects the same packet loss for UDP upstream traffic. You can also look at a chart for round trip time, but I didn’t include it as virtually all times were less than 1 ms.
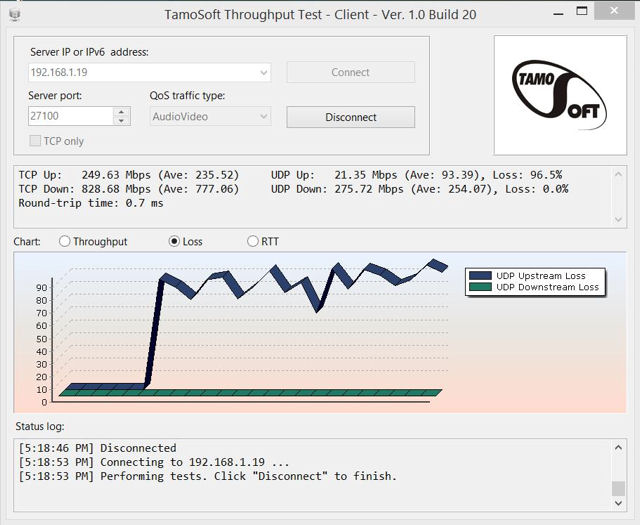
TamoSoft UDP Loss
As with LANBench, TamoSoft Throughput Test doesn’t provide any automated logging of the results, the test will keep running until you click Disconnect. It does, however, provide a nice graphic output and lets you test different QoS profiles.
Closing Thoughts
Each of the three products brings something different to the party. LANBench lets you specify packet size, test duration and choose from send only, receive only or send and receive and run with multiple connections. NetIO-GUI automatically tests a range of packet sizes and lets you choose TCP or UDP protocols. It is the only product of the three that saves tests results automatically for future analysis. Finally, TamoSoft Throughput Test provides a nice graphical output, but doesn’t let you specify packet size or provide for unidirectional tests. It is, however, the only one that identified a UDP packet loss problem.
Which tool provides the most accurate results? That’s hard to tell without having corresponding ixChariot results to compare. But many times all you need is a relative measure of performance and for that, most any tool will do as long as the tool itself doesn’t limit performance.
What is significant is that each of the tools identified that there was an imbalance between sending and receiving between two virtually new computers. And TamoSoft Throughput test identified a UDP packet loss problem. Those are both things that I didn’t know before starting this article and something that I need to resolve. With each product offering something different, why not download all three? They are all free and you can get results from each one in less than 5 minutes.
