One of the features I’ve seen in newer small network routers is the inclusion
of a packet sniffer/capture/trace tool within the diagnostic menus of the device. Routers I’ve recently tested with this functionality include the SonicWall TZ190W, D-Link DFLCPG310, and Netgear’s newly released FVX538 and FVS336G.
In each case, these devices have the ability to capture packets on a specific WAN port and/or on the LAN interface. Some of these routers have more sophisticated filtering capabilities than the other, but they all seem to have the same basic functionality of capturing packets.
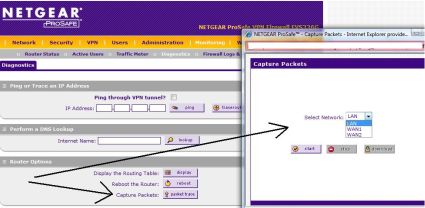
For example, on the Netgear FVS336G, capturing data traversing the router is done by simply clicking on the Capture Packets button withing the Diagnostic menu, and then selecting which interface is to be monitored (Figure 1).
Figure 1: Packet capture on the Netgear FVS336G
Once an interface is selected, the router-based tool is simply started and stopped for traffic collection, and then the file of collected data can be downloaded to a PC for analysis. The analysis of the data is then done by using packet capture software, such as the well known Wireshark, formerly Ethereal.
This powerful software continues to evolve over time with greater capabilities and features, yet it remains free for download and general use. Impressively, there are versions of Wireshark for Windows, including Vista, as well as Linux, Apple’s OSX, and Unix. There are alternative packet capture software tools, such as Microsoft’s Network Monitor Tool, as well as the Unix/Linux based Ettercap, yet Wireshark seems to be one of the most commonly used.
The goal of this series is to provide some direction on how to use Wireshark to do some pretty interesting network analysis and troubleshooting on a network, which is something any network administrator can use to better manage his or her network.
The first step is to download and install the software. You’ll want to make sure you install WinPcap along with Wireshark. Note that Wireshark can also perform packet captures directly using your PC’s wired or wireless interfaces, using WinPcap.
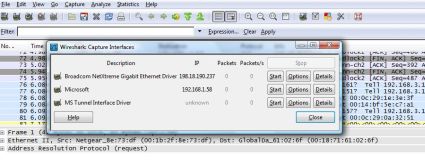
Once you’ve got the software installed, verify that it can detect your interfaces. Clicking on Capture – Interfaces will give you a display of detected interfaces and their IP addresses, such as shown in Figure 2.
Figure 2: Wireshark Interfaces
You want to make sure your interfaces are detected, otherwise you won’t be able to use the full power of the software. I’ve had trouble getting WinPcap running on some PCs, which I’ve usually resolved through a little software un-installation and re-installation, so get this out of the way first.
With Wireshark successfully installed on your PC, try doing a simple capture of some basic web traffic to get familiar with the tool. Simply click Capture and then Start with your PC connected to the Internet, and fire up a browser to an Internet web page. You’ll see a whole bunch of messages scrolling up and down the screen, filling in data in the No., Time, Source, Destination, Protocol, and Info columns. Click Capture and Stop to end this sample packet capture.
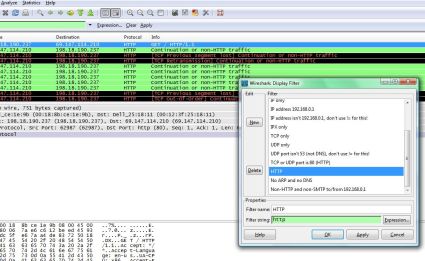
Now that you have some collected data, you can use the power of the tool to read and understand what type of traffic we’ve captured. To look at only the Web generated traffic from our packet capture, click on Analyze and Display Filters from the top menu bar. This will show a list of pre-made filters that can be used to show common traffic types. For example, clicking on HTTP from the list of Filters will narrow down the captured output to the packets sent and received between my PC and the web pages I opened while the capture was running (Figure 3).
Figure 3: Applying the HTTP filter
I now have numerous lines of output, which I can further examine and see my source and destination IP addresses, port information, and various other details regarding the data flows I have just generated.
This initial data may not be all that interesting to look at, but this example just scratches the surface. There are numerous applications for using a packet capture tool, such as in validating network connectivity, authentication troubleshooting, and wireless network analysis, to name a few. In the next installment of this series, I’ll go into more depth on reading the information in the packets and some more uses for these powerful tools.


