Introduction
Atheros announced its Super-G throughput enhancement technology back in April of this year, but it’s taken until now for products to hit the shelves. Something else is hitting the ,er, fan, though, in the form of a controversy stirred up by rival WLAN chipmaker Broadcom during the recent Las Vegas Comdex show.
As I described in my Comdex coverage, the short story is that Broadcom is asserting that Atheros’ Super-G based products will interfere with neighboring 802.11b and g networks, severely limiting their speed and, in some cases, shutting them down completely.
Broadcom’s demo used a video streamed via Broadcom 11g equipment operated in close proximity to a second WLAN using NETGEAR’s WGT624 108Mbps router and WG511T 108Mbps Cardbus card, both of which use Atheros chipsets with Super-G enhancement.
In this NTK, I’ll first explain what Super-G is and then explore the key source of Broadcom’s concern. I’ll then present the results of tests that I’ve run in my home office environment pitting not just Super-G against “normal” 11g wireless LANs, but also “normal” 11g WLANs against each other.
Throughput Enhancement Technologies
Updated December 9, 2003
The ink had hardly dried on the 802.11g standard when wireless chip manufacturers started to roll out non-standard throughput “enhancement” technologies. Intersil (>GlobespanVirata>Conexant) introduced Nitro and Atheros announced Super-G at the Networld+Interop Las Vegas show in late April 2003.
Broadcom was notably absent from this first round of announcements, opting instead (in a surprisingly conservative move) to wait until the ratification of 802.11g on June 13 to introduce its Xpress technology.
The differences boil down to these basic points:
- Nitro and Xpress are primarily focused on enhancing the total throughput of multiple devices that use them in mixed 802.11b / g networks. (You may see slight throughput improvement for a single AP / client pair, depending on drivers, OSes and other factors.)
- Nitro and Xpress primarily use “packet (or frame) bursting” to provide throughput enhancement
- Super-G enhances the throughput of even a single AP / client pair (i.e. measured improvement doesn’t depend on calculating the total throughput of multiple devices in a WLAN)
- Super-G uses packet-bursting, “fast frames”, on-the-fly data compression / decompression, and dual-channel bonding to provide throughput enhancement
 Tip: Atheros has not released its own Super-G White paper. But if you can wade through the marketing happy-talk, the “How it Works” section of NETGEAR’s NETGEAR 108 Mbps Wireless Solution: Technology Overview (PDF) paper contains some helpful info.
As you can see, Nitro, Xpress and Super-G all use some form of packet-bursting, which speeds things up by removing the pause (to check for other stations that may want to send data) that normally occurs between packets. Since this feature is part of the 802.11e draft standard for Quality of Service (QoS), it’s not at issue.
Neither is Super-G’s “fast frames” feature – which inserts multiple data packets into a single data frame – since it’s also part of the 802.11e draft. Broadcom could argue that the on-the-fly data compression / decompression is a problem, but the main objection is to Super-G’s dual-channel bonding feature.
Broadcom alleges that Super-G’s channel bonding feature can significantly degrade the performance of neighboring 2.4GHz WLANs that don’t use Super-G. Broadcom’s Comdex demos focused on showing two Super-G behaviors that Broadcom says are the root of the problem:
- There isn’t enough room in the 2.4GHz wireless LAN spectrum for the increased spectrum used by channel bonding
- Super-G doesn’t check to see if 11b or 11g standards-compliant devices are in range before using its non-standard techniques
This NTK will explore both of these points, but let’s first look at the spectrum-use issue.
Mondo bondage
Atheros’ Channel Bonding technology isn’t new, since it’s been used for a few years now in Atheros’ 802.11a “Turbo” feature. NETGEAR’s 108Mbps Technology overview paper explains that Channel Bonding works by using two radio channels in a way that they appear as a single, higher-speed channel to both the transmitter and receiver. The effect is similar to “multilink” techniques used by ISDN and some dialup ISPs, although the exact mechanics are different.
The upside is that Super-G really does provide significantly increased throughput and – unlike Nitro and Xpress – doesn’t rely on mixed mode aggregate throughput gains to provide its benefit.
The downside – as Broadcom wants everyone to know – is that Channel Bonding cuts a wider swath in the 2.4GHz spectrum, allegedly interfering with all eleven channels in the 2.4GHz 802.11b/g band. As I’ll show shortly, Super-G with channel bonding does use more spectrum than a single, unbonded channel (sorta makes sense doesn’t it?). But first let’s look at this spectrum that everyone’s so stirred up about.
The truth about channel overlap
802.11b and g use eleven channels in the 2.4GHz band, spaced at 5MHz intervals. Since the commonly accepted width of each channel is 22MHz for 802.11b and 20MHz for 802.11g, both 802.11b and g are said to have three non-overlapping channels (1, 6 and 11).
Now if all the energy of the transmitted signal actually were contained within a 20 (or 22MHz) band, the definition of “non-overlapping” might be simpler. But reality is somewhat more complicated.
Figure 1: 802.11b Transmit Spectrum Mask
From Matthew Gast’s 802.11 Wireless Networks: The Definitive Guide , used by permission
Figure 1 shows an idealized spectral plot (power vs frequency) of an 802.11b signal. To paraphrase the explanation in Chapter 10 of Matthew Gast’s excellent book, this plot shows that transmitted power is reduced by 30dB below (1/1,000) the power at the center of the channel (that’s what the dBr notation means) at +/-11MHz away from the channel center and 50dB below (1/100,000) at +/-22MHz away.
NOTE: The following spectrum diagrams are based on Figure 1 and are not done to exact scale. Any inaccuracies are not intentional!
Since 11b and g channels are on 5MHz spacings, two channels right next to each other (1 and 2 for example) would overlap as shown in Figure 2.
Figure 2: 802.11b adjacent channel overlap
The yellow shaded area represents the power from channel 2’s signal that overlaps into channel 1’s main lobe (the largest “hump” and also the frequency band that contains most of the signal’s power). Since a significant amount of channel 2’s main lobe overlaps into channel 1’s main lobe (and vice versa), communication on both channels will suffer. Contrast this picture with the situation shown in Figure 3.

Figure 3: 802.11b “non-overlapping” channel overlap
This figure has the same scale as Figure 2, but shows signals in the “non-overlapping” channels 1, 6 and 11. Since the power from each signal doesn’t magically stop at the 22MHz channel boundaries, there is still overlap between “non-overlapping” channels. But in this case, the yellow shaded area that represents channel 11’s power that is overlapping into the main lobe of channel 6 is at least 30 dB lower (1/1000) than channel 11’s peak power.
Put simply, channels 1, 6 and 11 are considered to be “non-overlapping” because the amount of power that does overlap is supposedly too small to significantly affect each channel’s operation. Whether that’s actually the case, however, depends on many other factors, including the device’s Adjacent Channel Rejection (ACR) capability, and, of course, the distance between devices on different channels. By the way, although I’ve been using examples based on 802.11b, the situation is pretty much the same for 802.11g.
Theory, however, is nice, but what happens in the real world? That’s what I’ll show next.
Real-world 11g overlap
Both Atheros and Broadcom were kind enough to supply spectrum analyzer screen shots that will help show what real 802.11g signals look like.
Figure 4: Real Channel 1, 6, 11 802.11g signals (from Atheros)
Figure 4 shows an composite spectrum analyzer screen shot, supplied by Atheros, of 802.11g signals for the “non-overlapping” channels 1, 6 and 11, with 20MHz channel boundaries marked on the shot for reference. The shapes of the signals look different from those shown in Figure 3 because filtering is applied in the WLAN devices to shape the signal. But you can clearly see that power from each channel’s signal overlaps into each other’s.
Also notice that each channel’s signal is down about 30dB (1/1000) from its peak level by the time it overlaps into the next closest signal. With current radio design technology, this means the overlapping signal has little effect on the primary (i.e. desired) channel.
Figure 5: Real Channel 6 802.11g signal (from Broadcom)
So that I don’t get accused of playing favorites, Figure 5 shows a similar spectrum analyzer screen shot supplied by Broadcom. Only channel 6 is shown and the top 20dB of channel 1 and 11’s signals are drawn in for reference.
The point of this whole exercise has been to make a simple point:
Key Point #1: Normal “non-overlapping” 802.11b and 11g channel 1, 6, and 11 signals do overlap.
So if normal 802.11b / g signals overlap, i.e. interfere with each other, what’s the big deal about Super-G’s signal doing the same thing? The issue the amount of overlap.
11g / Super-G overlap
Figure 6 shows another spectrum analyzer composite shot supplied by Atheros.
Figure 6: Super-G and normal 11g signal overlap (from Atheros)
This time, it shows normal 11g signals on channels 1 and 11 and a Super-G “static turbo” signal centered on channel 6 from a WLAN approximately 35 feet away from the normal 11g devices. The amount of overlap between the normal 11g and Super-G signals would have more clearly illustrated if all had been plotted at the same distance so that all peak signal levels were equal, but this is what Atheros supplied.
Figure 7: Super-G and normal 11g signal overlap (from Broadcom)
Broadcom’s shot in Figure 7, though, shows a full-strength Super-G signal overlapping into drawn-in markings for channels 1 and 11 so that you’re sure to see that the Super-G signal is pretty much at full strength when it first overlaps into both “non-overlapping” channels.
- Super-G has dynamic (auto) and static modes. Static mode is intended to be used in all Super-G WLANs and kicks in all of Super-G’s features, including channel bonding.
- Super-G mode is centered on channel 6 and can’t be moved.
- Dynamic mode is intended to be used in mixed WLANs and takes into account the types of stations (clients) in the WLAN and their bandwidth demands.
- The Super-G signal shown in Figures 6 and 7 is what you’d see in static mode or dynamic mode under maximum bandwidth demand conditions.
So now we’ve established a second key point:
Key Point #2: Under similar range and bandwidth demand conditions, Super-G signals can have a greater degree of overlap into channel 1 and 11 than a normal 11g channel 6 signal.
With those points in mind, it’s now time to put them to the test.
Getting Ready to Test
Broadcom’s key allegation about Super-G is that it will severely interfere or, in some cases, completely shut down nearby non Super-G 2.4GHz-based wireless LANs, i.e. the “bad neighbor” effect. So I assembled two wireless LANs, configured into the test bed shown in Figure 8.
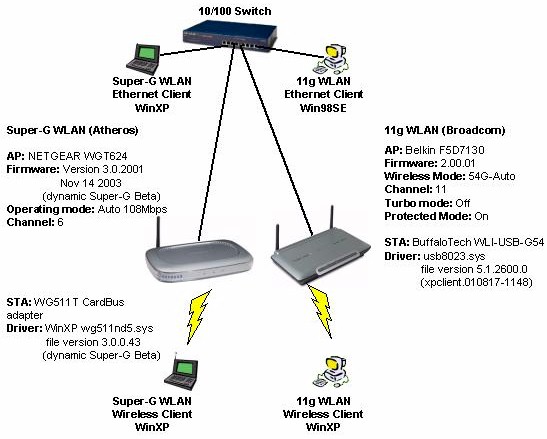
Figure 8: Basic Super-G Test setup (click on the image for a full-sized view)
The setup has two completely independent wireless LANs – one Super-G based and the other using gear based on Broadcom’s 11g chipset. All APs and Ethernet test partners were plugged into a 10/100 switch and everything was assigned IP addresses in a single Class C subnet (192.168.3.X).
Since one of the two WLANs had to move to test at varying distances, and because I have only two notebooks, I used them both in the Super-G half of my test rig to make things easy to move around. This meant using a desktop machine and 11g USB2.0 adapters in the 11g half of my testbed, which remained stationary for all tests.
Ixia’s IxChariot was used for all testing, with the console running on the Super-G laptop.
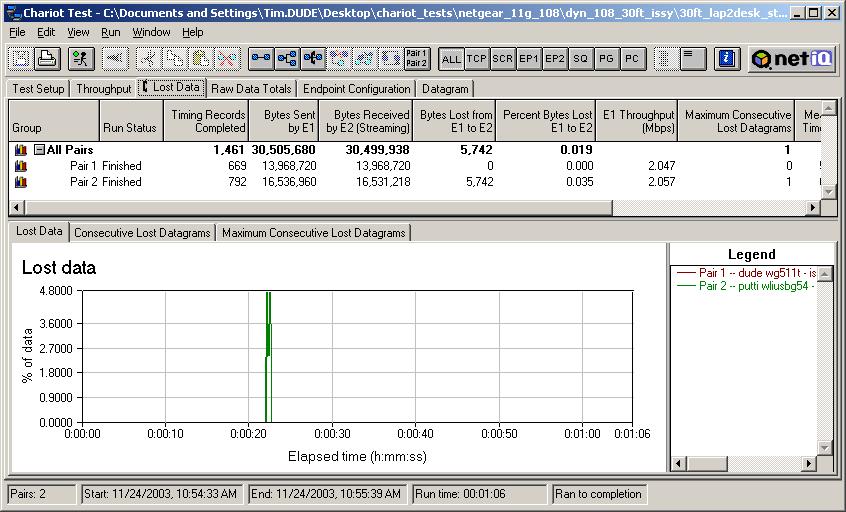
11g vs. 11g – Streaming
Atheros has said that Broadcom is harping on something common to all 802.11g products and that interference will also be generated by “normal” 802.11g WLANs operating in close proximity. So I first wanted to test to see if this were true.
Since Broadcom used a 2Mbps MPEG stream as part of their Comdex demonstration, I also wanted to include streaming as part of my testing. But I wanted a measure more quantitative than trying to describe the degree of jerkiness in a streaming video of The Matrix.
Fortunately, Chariot includes the ability to simulate video streams, and calculates the Lost Data in a stream. Due to the buffering and error recovery mechanisms built into streaming protocols, it’s difficult to directly correlate a Lost Data number to the number and severity of glitches in a streaming video. But it’s safe to say that lower Lost Data numbers are better than higher, and using Lost Data as a measurement is a hell of a lot easier than trying to describe how a video is breaking up!
Chariot doesn’t include MPEG streams among its test scripts. So I had to make do using the NetMtgv.scr script, which emulates a NetMeeting 2.1 Video stream. I used UDP as the protocol and set the stream rate to 2.048Mbps.
Because the bit rate is limited to 2Mbps, the spectrum generated isn’t very wide, which should limit the channel overlap, and therefore the amount of performance degradation.
|
My first round of tests were run with the following conditions:
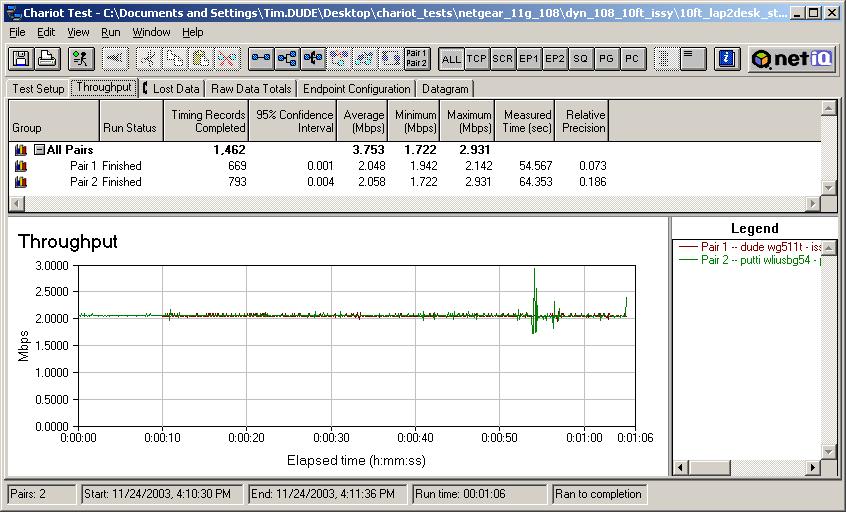
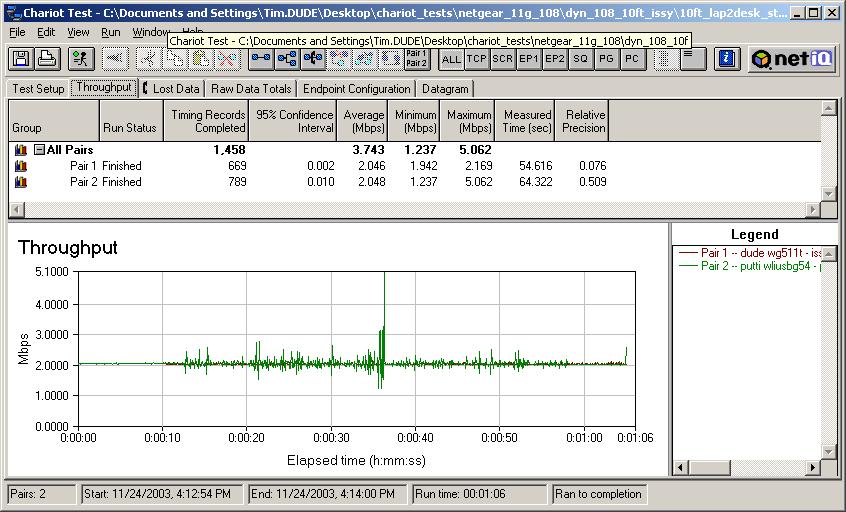
Figure 9 shows the throughput plot for the test, which doesn’t really tell you much. The blip near the end of the test appears in most tests and is caused by a periodic scan done as part of Broadcom’s driver. Updated December 6, 2003
|
Figure 9: Throughput for Atheros 11g vs Broadcom 11g – 2Mbps streams – 10ft
|

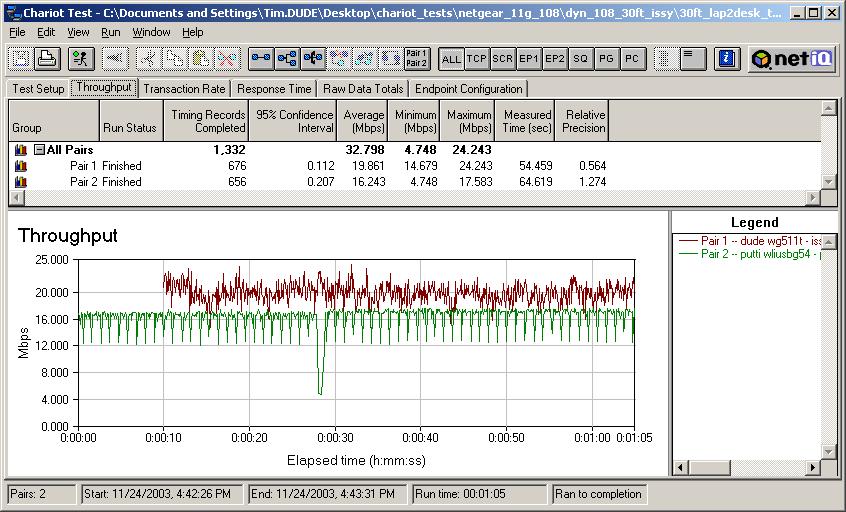
11g vs. 11g – Maximum Throughput
|
My second set of 11g-only tests used the same products and same distances. But this time, I used the Chariot Throughput.scr to stimulate both WLANs. This script simply blasts a file between each test pair. I used a 200,000 Byte file size, TCP protocol and no delay between file sends. Here’s the complete list of conditions:
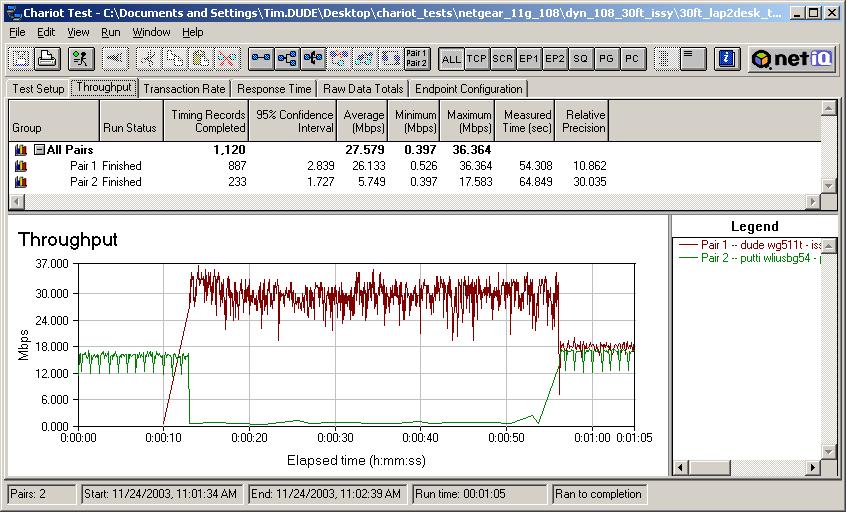
Because this test uses all the bandwidth that each WLAN has to give, the spectrum generated by each WLAN will be maximum width, resulting in a worst-case channel overlap and worst-case interference scenario. Figure 13 clearly shows that both WLANs suffer from their neighbor running at full-blast. Figures 14 and 15, though, show the interference gone with the WLANs separated by 30 and 50 feet, respectively. Conclusion for this round: |
Figure 13: Atheros 11g vs Broadcom 11g throughput – 10ft
|


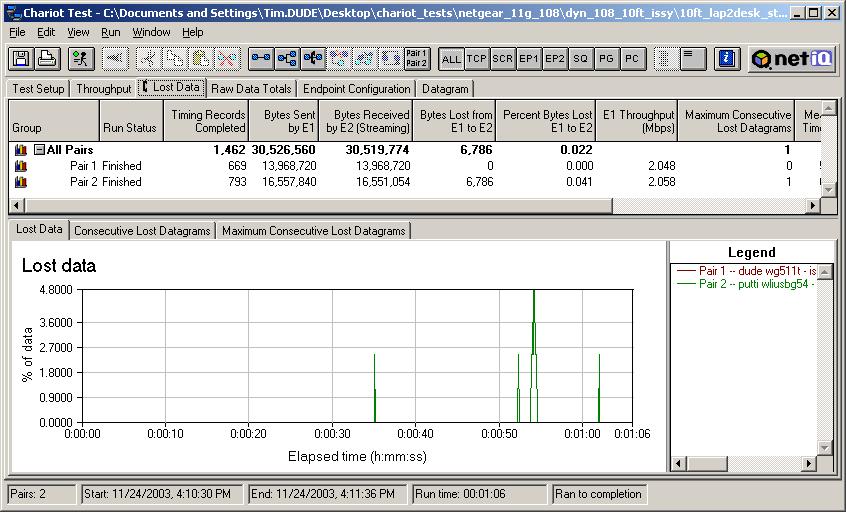
11g vs. 11g – Streaming and Max. Throughput
|
My last set of 11g-only tests mixes the two scenarios by running the streaming script on the Broadcom-based WLAN and the throughput script on the Atheros-based. The details:
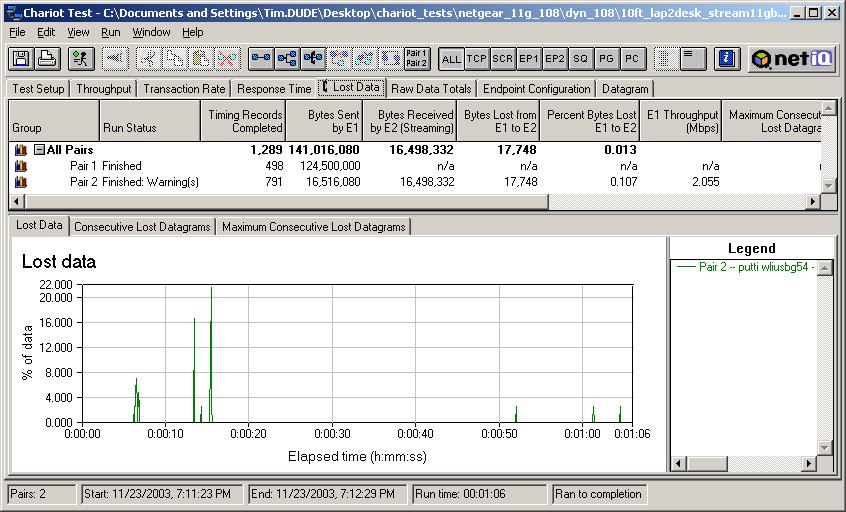
This test is intended to emulate the Broadcom Comdex demo (except that it uses two 802.11g WLANs) and determine the level of interference on a video stream from a nearby WLAN that’s running as fast as it can go. The throughput plot for the stream in Figure 16 is significantly more spiky than Figure 9 and the Lost Data plot confirms a higher Data Loss of 0.107%, vs. the 0.041% lost in the stream vs. stream test. Note, though, that most of the loss comes from one glitch in the stream that occurs shortly after the throughput script starts running. I didn’t run these tests at 30 and 50 feet, because from my previous testing, I knew the interference would be essentially gone for both tests. Conclusion for round 3: With the 11g vs. 11g testing out of the way, I moved on to the main event – Super-G vs. Broadcom 11g! |
Figure 16: Throughput for Broadcom 11g 2Mbps stream vs Atheros 11g throughput – 10ft
|
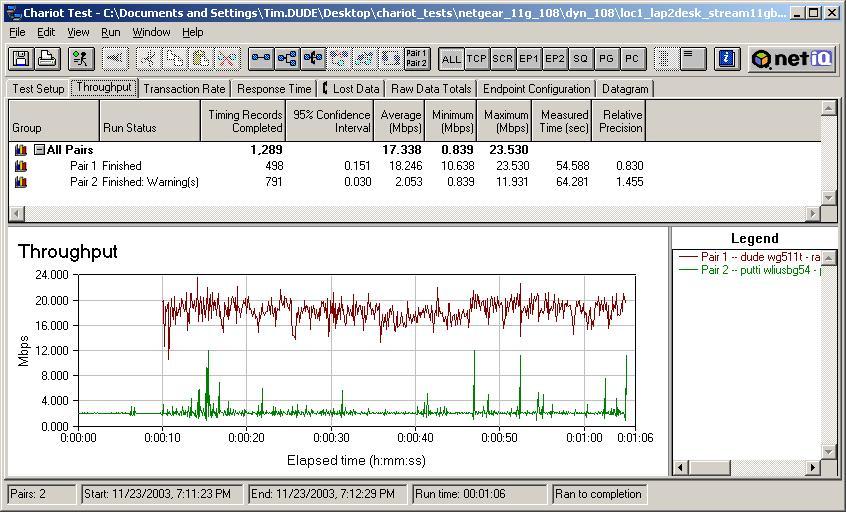
Super-G vs. Broadcom 11g – Streaming
|
Super-G vs. Broadcom 11g testing consisted of taking the previous scenarios and repeating them with the Atheros-based NETGEAR pair now set to Super-G mode. The full implementation of Super-G has both static and dynamic modes. Among the differences are that static mode devices will only talk to other Super-G devices and channel bonding is always kicked in. Dynamic mode in an AP lets 802.11b, 11g, and Super-G STAs all associate and transfer data and switches in channel bonding only when bandwidth demands require it. Although NETGEAR’s WG511T and WGT624 have been shipping with only static Super-G capability, NETGEAR recently posted BETA dynamic Super-G code. I tried both and found little difference when running the streaming and throughput scripts, so opted to use the more recent dynamic Super-G for my testing. |
|
|
First up were the streaming vs. streaming tests. The setup:
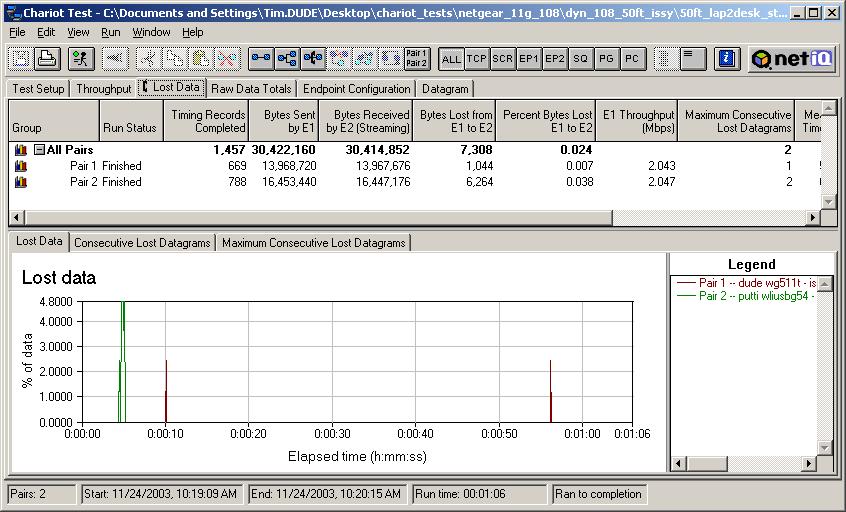
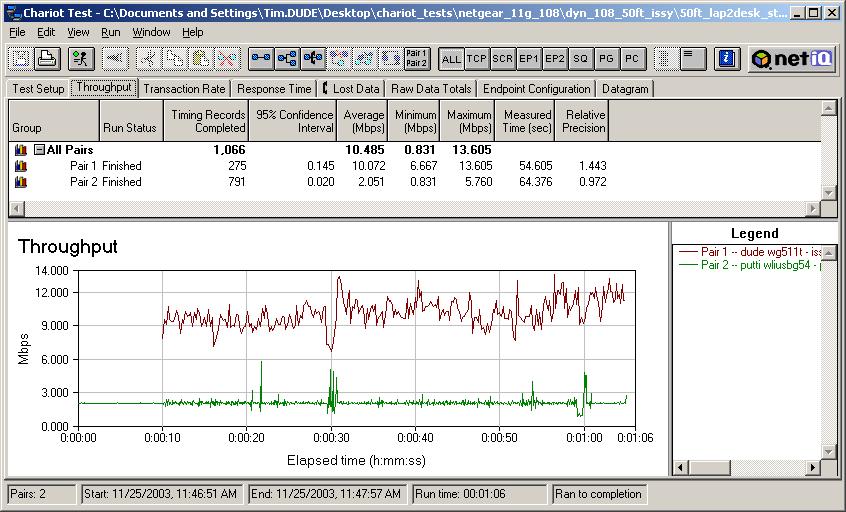
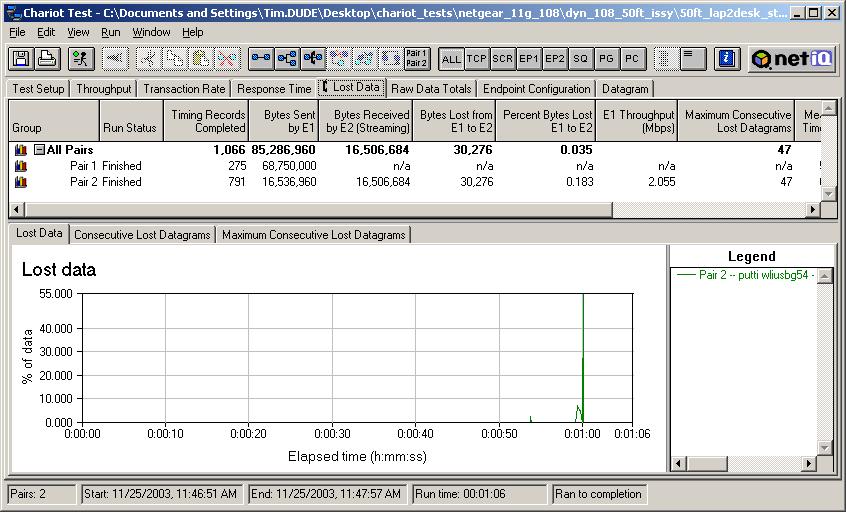
Once again the throughput plot isn’t very informative, so I’ve only shown it in Figure 18 for the 10 foot test. At 0.051%, Lost Data in the 11g stream is a little higher than the 0.041% shown in Figure 10, but, once again, doesn’t represent significant performance degradation. Figures 20 and 21 show Lost Data at 30 feet and 50 feet, coming in at 0.038% in both cases. Conclusion: |
Figure 18: Throughput for Atheros Super-G vs Broadcom 11g – 2Mbps streams – 10ft
|


Super-G vs. Broadcom 11g – Maximum throughput
|
When I repeated my throughput tests with Super-G enabled, things got a little more interesting. The setup summary:
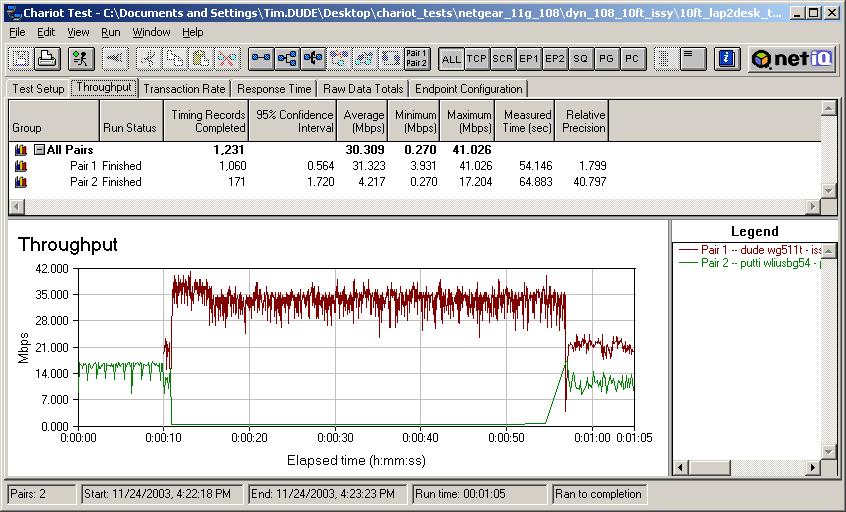
Figure 22 shows that the Super-G WLAN pretty much shuts down the 11g WLAN, with little disturbance to the Super-G WLAN itself. Things improve a little at 30 feet (Figure 23), but the 11g WLAN still doesn’t get much air time. Finally, at 50 feet, the 11g WLAN starts to get some wind back into its sails (Figure 24). But it’s still significantly slowed by the Super-G WLAN running full blast. By the way, the drop in Super-G throughput around the 55 second mark is not due to interaction between the Super-G and 11g WLANs, but instead to part of dynamic Super-G’s algorithms. It appears that even if a dynamic Super-G AP doesn’t detect “normal” 11g or 11b clients in range, it will fall back to normal 11g on a periodic basis. The timing appeared to be 45 seconds of Super-G and 15 seconds of 11g in the NETGEAR BETA dynamic Super-G updates that I used. A different implementation of dynamic Super-G in D-Link Super-G enabled gear used by Broadcom in its testing showed the timing to be 120 seconds of Super-G and 75 seconds of 11g. So it looks like Atheros, NETGEAR, or both are doing some performance tuning. Conclusion: |
Figure 22: Throughput for Atheros Super-G vs Broadcom 11g – 10ft
|

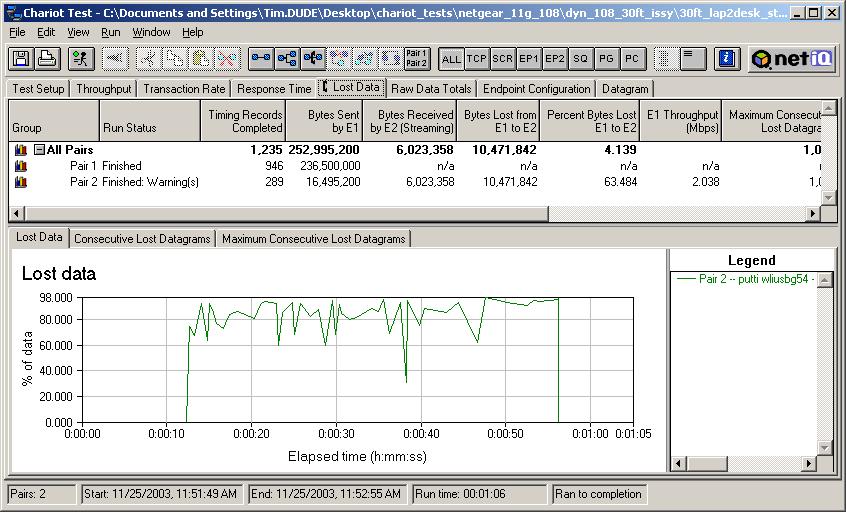
Super-G vs. Broadcom 11g – Streaming and Max. Throughput
|
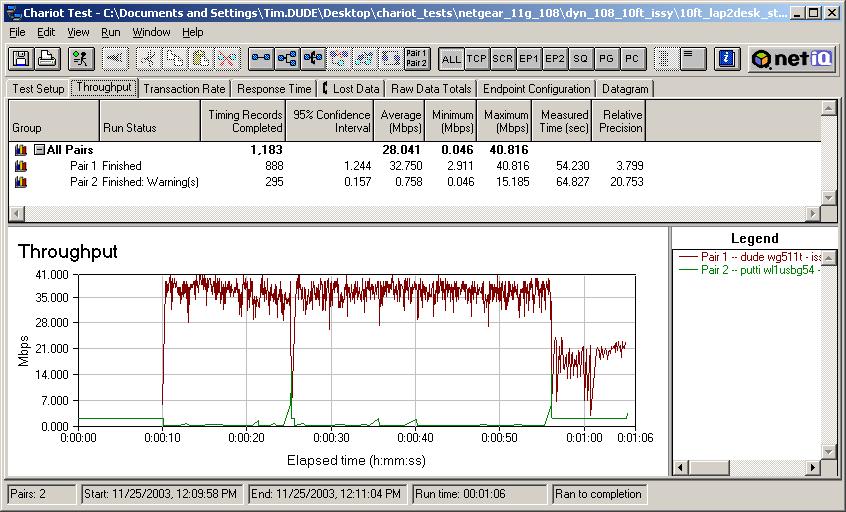
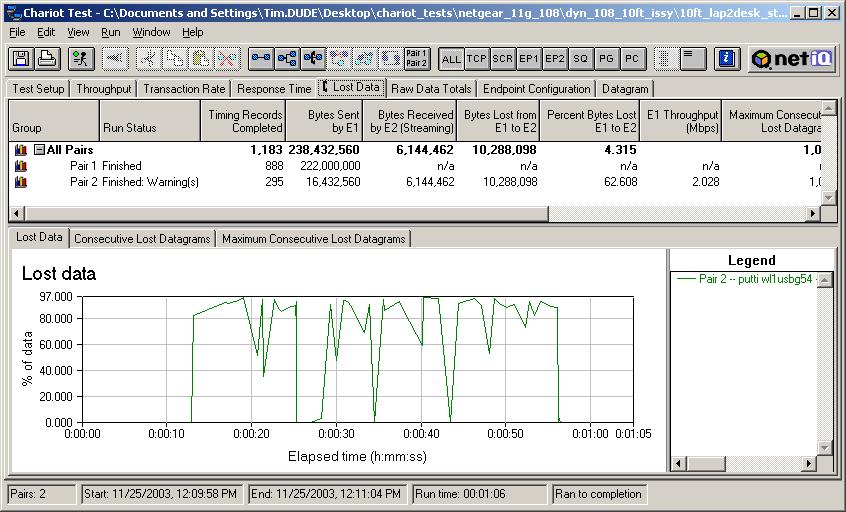
In the last set of tests, I finally simulate Broadcom’s Comdex demo, i.e. Super-G vs. a Broadcom-based 11g stream. This time both the throughput and Lost Data plots are worth showing, because you can clearly see differences in both. At 10 feet, Figure 25 shows that streaming throughput takes a hit and Figure 26 shows data loss between 60 and 100% when the Super-G WLAN is running at maximum speed. When Super-G drops back to normal 11g near the end of the run, you can see throughput come back up to 2Mbps and Data Loss drop to zero, as we saw in the 11g-only testing. Figures 27 and 28 tell a similar story at 30 feet. But when the WLANs are 50 feet apart Figures 29 and 30 show little Super-G disturbance of the 11g WLAN. Conclusion: |
Figure 25: Throughput for Broadcom 11g 2Mbps stream vs Atheros Super-G throughput – 10ft
|
Recap
This is probably a good point to stop and sum up my conclusions so far:
- You’d be unlikely to notice interference between two 11g WLANs running video streams at any distance
- Two 11g WLANs running at full speed (long downloads for example) can interfere at close range
- It’s unlikely you’d be significantly bothered by a neighbor’s heavily used 802.11g WLAN while watching a wirelessly streamed video on your own.
- A nearby Super-G WLAN running a 2Mbps video stream will probably not cause significant interference to an 11g WLAN that’s also streaming a video
- A Super-G wireless LAN running at full speed will interfere with an 11g WLAN also running at full speed. Severe throughput loss in the 11g WLAN can occur up to 30 feet away and significant throughput loss may still be seen around 50 feet
- Updated December 6, 2003 A Super-G WLAN running at full speed will seriously interfere with an 11g WLAN running 2Mbps streaming video even at 30 feet. The interference is essentially gone at 50 feet.
These results would seem to more strongly support Broadcom’s assertions than Atheros’ counter-arguments, since under most of the same test conditions, two 11g WLANs don’t interfere with each other, but Super-G and 11g WLANs do.
And while it’s true that two 11g WLANs can interfere with each other as Atheros contends, it’s only when both are running full-tilt, and even then, the interference is gone by the time the WLANs are separated by 30 feet – well short of the 100 feet that Atheros has been quoted as saying will be the 11g interference zone.
But before you go off wondering why Atheros would create “an 802.11g jammer” – to quote one Broadcom marketing exec, instead of a new standard in wireless LAN performance, continue on to Part 2 of this Need To Know.
In it, I’ll show that looking at just Broadcom-based 11g vs. Atheros gear doesn’t tell the entire Super-G story and I’ll also explore the relationship between Super-G and improved range. And, of course, I’ll have my own two cents to contribute to this whole mess.