Introduction
If you’ve been following the saga of draft 802.11n, you know that most reviewers have said to hold off on purchasing products based on this draft standard. If that’s all you want to know, then you can skip the rest of this article. But if you’d like to know more about whether these science experiments really deliver on their claims to expand both wireless speed and range, then stay right here.
I spent last week using an Azimuth Systems W-Series WLAN Test Platform to test three sets of draft 802.11n routers and CardBus cards for throughput vs. range performance. I also checked to see whether the products would behave more courteously toward an adjacent 802.11g WLAN than Netgear’s RangeMax 240 that I tested back in January. The results were definitely eye-opening and may shake things up a bit among the draft 11n chip vendors and the consumer networking companies shipping these half-baked products.
The Products
I tested two products based on Broadcom’s Intensi-fi chipset and one using Marvell’s TopDog. And while Airgo has steadfastly refused to participate in the draft 11n feeding frenzy, I also included a product using its third generation (Gen 3) chipset – Airgo’s solution for draft 11n-like performance. I decided to include an Airgo Gen 3 product initially to see how it performed in the adjacent legacy WLAN tests. But I also ran throughput vs. range tests and was glad that I did (you’ll see why later).
Since products using Atheros’ xspaN draft 11n chipset won’t be available until later this month (June 2006), I couldn’t include them in the testing.
The Broadcom Intensi-fi based products were the Linksys WRT-300N Wireless-N Broadband Router and WPC-300N Notebook Adapter…
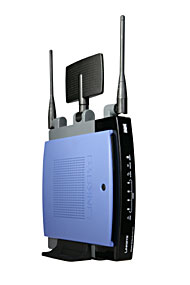
Figure 1: Linksys WRT-300N Wireless-N Broadband Router
and Buffalo WZR-G300N AirStation Nfiniti Wireless Router & Access Point and WLI-CB-G300N Notebook Adapter.
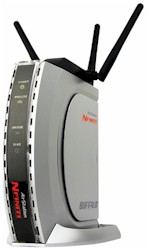
Figure 2: Buffalo WZR-G300N AirStation Nfiniti Wireless Router & Access Point
The Marvell TopDog based product was the Netgear WNR854T RangeMax Next Wireless Router – Gigabit Edition and WN511T Notebook Adapter.
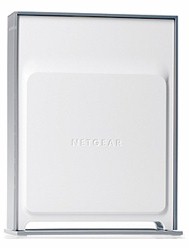
Figure 3: Netgear WNR854T RangeMax Next Wireless Router – Gigabit Edition
Finally, the Netgear WPNT834 RangeMax 240 Wireless Router and WPNT511 Notebook Adapter represented Airgo’s Gen 3 chipset.
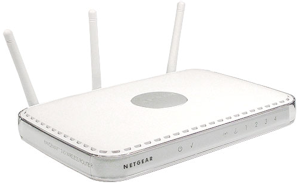
Figure 4: Netgear WPNT834 RangeMax 240 Wireless Router
To ensure that the products were the same as normal consumers can purchase, all the products tested were obtained from online retailers.
Internal Details
I was able to take some shots of the product boards since all the cases had to be opened to access antenna connections. Figure 5 shows the Buffalo router board, which uses a Broadcom BCM4704 processor, BCM5325 10/100 switch, 4 MB of flash and 16 MB of RAM. The radio is on a rather large mini-PCI board that plugs into the main board.
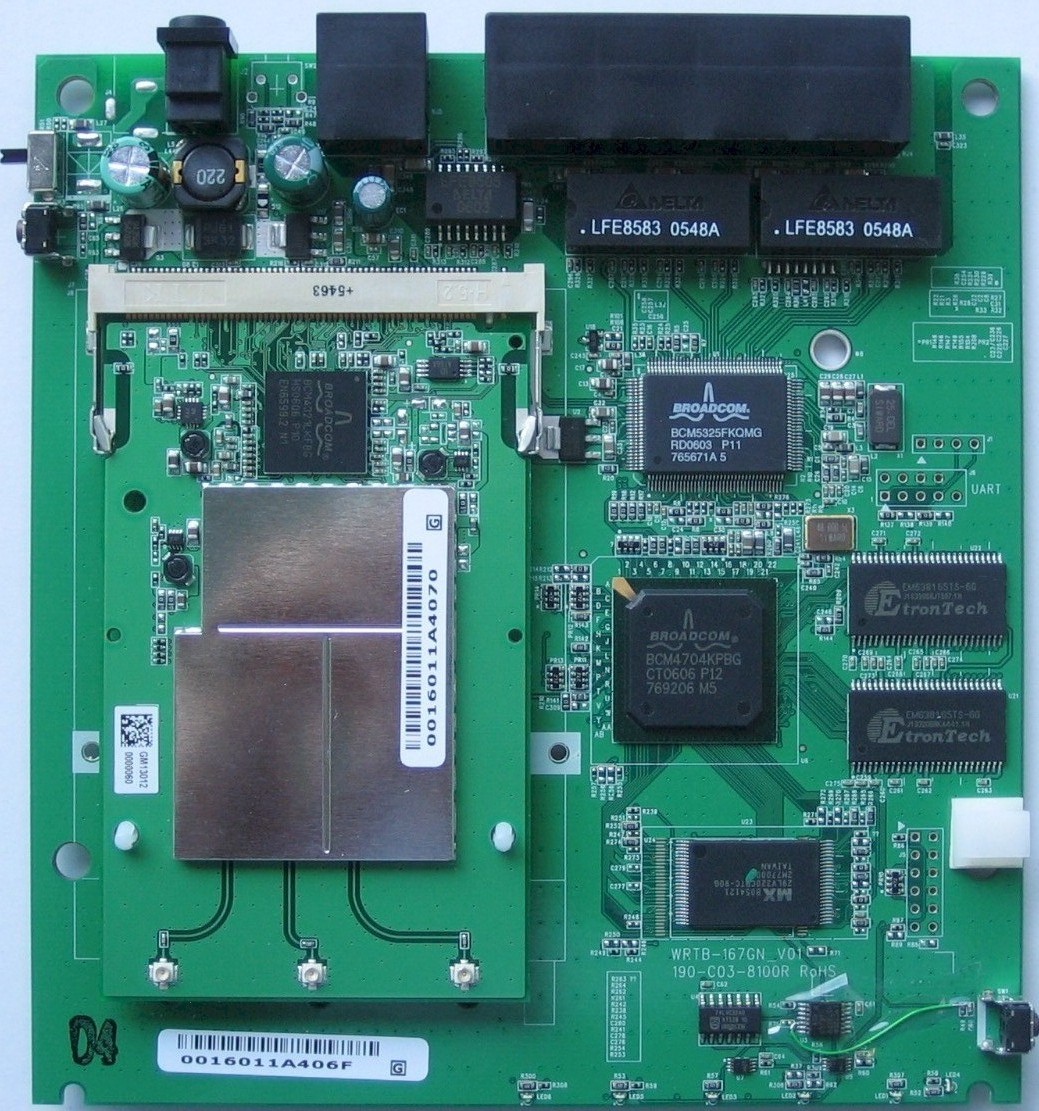
Figure 5: Buffalo WZR-G300N board (Click to Enlarge)
The Netgear WNR854T board is shown in Figure 6. The processor and switch are covered, but Marvell’s TopDog pages indicate the processor would be the 88W8360. I’m not sure which gigabit switch chip is used, since it’s hidden under a heatsink. 8 MB of flash and 16 MB of RAM and a mini-PCI radio round out the design.
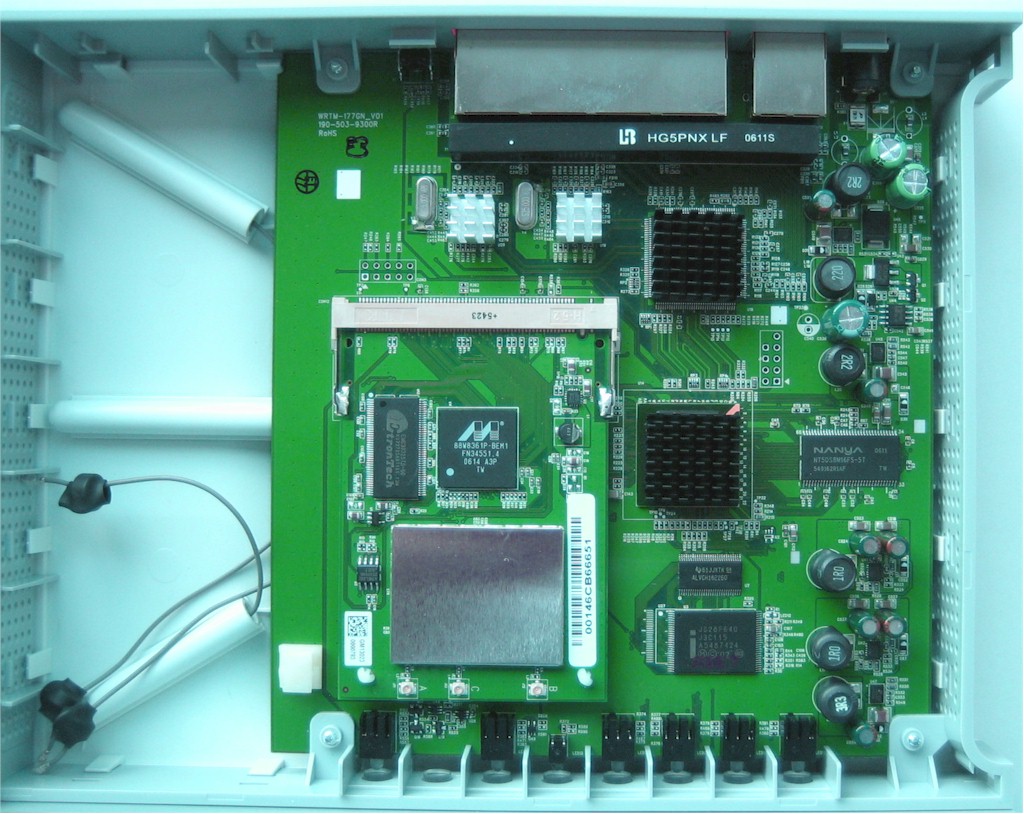
Figure 6: Netgear WNR854T board (Click to Enlarge)
In the Figure 7 photo of Linksys’ WRT-300N router board, you can see that most of the circuitry is covered by shields. Note that the Linksys design is physically different from Buffalo’s and uses a CardBus radio; probably the same as the WPC-300N, but with different covers.
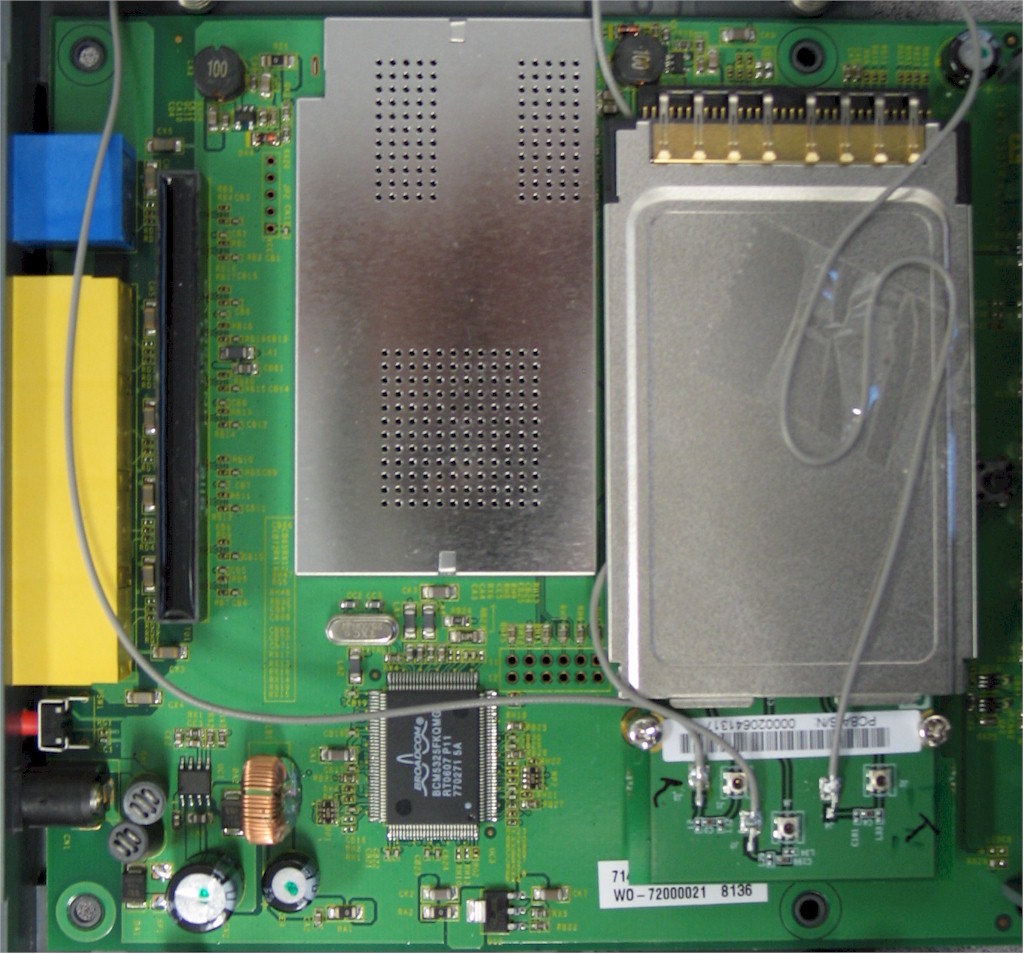
Figure 7: Linksys WRT-300N board (Click to Enlarge)
The Challenge Of Throughput Vs. Range Testing
Wireless LAN product manufacturers make speed and range claims for their products that always come with “your mileage may vary” disclaimers. The disclaimers attempt to protect the makers from false advertising claims and reflect the harsh reality that the nature of the wireless beast is that performance is highly dependent on the environment in which the products are used.
So most manufacturers test just as reviewers do: by parking the AP in a location, then moving a notebook containing a STA (or client) to multiple locations and running a throughput measurement using a steady traffic stream. There are variations on this theme, such as slowly spinning tables for the STA that attempt to cancel out antenna positioning effects. Manufacturers usually perform tests in multiple locations, some in employee’s homes, others in rented houses.
But in the end, comparing the results of any two tests in different environments is a crapshoot. Even with the most careful test setup and data recording methodology, all that can be said of the results is that they represent what happened under a very specific set of conditions.
To measure the ideal performance of WLAN products, you would want:
- An environment free of interfering signals
- The ability to attenuate the signal between AP (or wireless router) and client (also referred to as the Station or STA) in small, repeatable increments.
The first point would ensure that only the product under test is being measured, while the second provides the ability to simulate the effect of distance between AP and STA.
Ideally, what we’re after is to produce a throughput (or rate) vs. range plot that would look something like Figure 8, which is from Buffalo’s AirStation Turbo G High Power Wireless Smart Router marketing material.
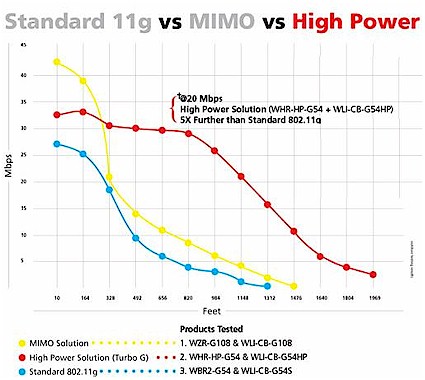
Figure 8: Buffalo Rate vs. Range Plot Example
The Y-axis represents throughput (or rate) in Mbps, which the X-axis represents distance in feet. Buffalo is actually pretty brave in publishing this curve, since most other manufacturers opt for squishier representations of performance. Figure 9 is from Linksys’ Wireless-N marketing collateral, in which there is no mention of actual throughput performance in Mbps.

Figure 9: Nice picture, but no useful information (from Linksys)
How We Tested
My wireless tests have always been done by the walk-it-around method, so are as flawed as anyone else’s. So when Azimuth asked whether I would consider testing draft 11n products using their system, I thought it as good a time as any to try a different test methodology.
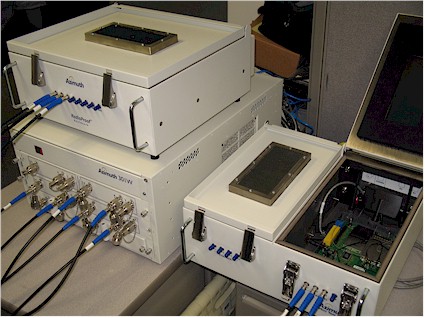
Azimuth’s approach puts both the AP and STA in RF-tight (they call this RadioProofTM) boxes. The enclosures come in different sizes and port configurations and typically provide 90 dB of isolation over 1 to 6 GHz. The enclosures include filtered power and data connections to prevent RF leakage from those sources. Putting the products under test in RF shielded enclosures essentially removes the problem of WLAN and other interference sources.
Once in the enclosures, the products under test were connected through programmable RF attenuators, which for MIMO testing have a 60 dB range and are used to attenuate signals to test “range” effects. Direct, cabled connection was made to all three antenna connectors on the AP and STA radio cards as shown in Figures 10 and 11 below. Connection was made in each case between antennas in the same card physical position (left-to-left, center-to-center, right-to-right).
Figure 10 shows the Linksys WRT-300N connected up for test in one of the test enclosures. You can see red and green Ethernet cables connecting to two LAN-side ports since Broadcom-based products don’t include gigabit Ethernet ports. So instead, for some tests I used the same two-Ethernet-client technique as in the RangeMax 240 review so that the 100Mbps port speed wouldn’t limit throughput test results, which are supposed to exceed 100Mbps.
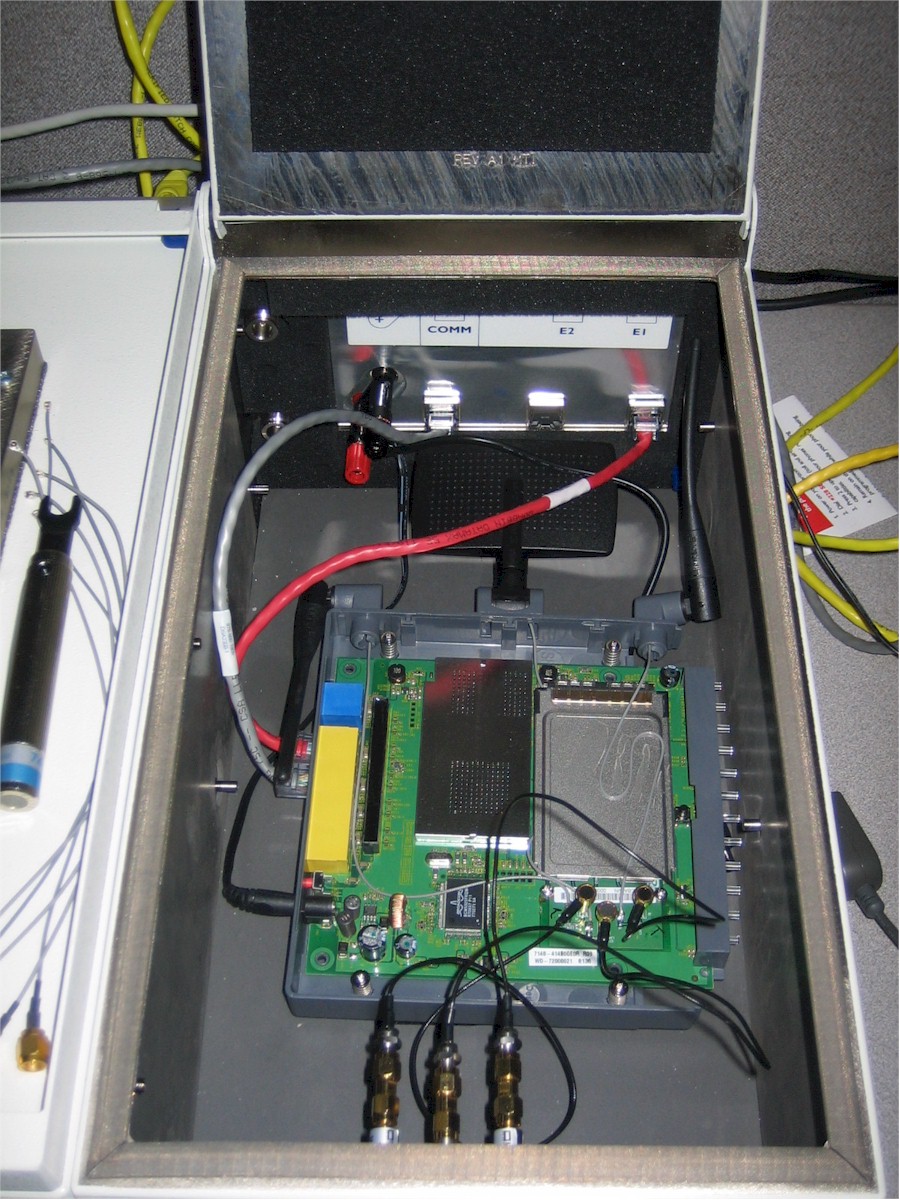
Figure 10: Linksys router in test enclosure (Click to Enlarge)
Figure 11 shows the Linksys WPC-300N Notebook card in an IBM / Lenovo T42 ThinkPad with a 1.7 GHz Pentium M and 512 MB of RAM. The Notebook was running WinXP Pro SP2 and Azimuth client software.

Figure 11: Linksys card in test enclosure (Click to Enlarge)
The table below summarizes the card driver and router firmware revisions tested.
| Product | Chipset | Driver or Firmware Revision |
|---|---|---|
| Linksys WRT-300N | Broadcom Intensi-fi | 0.92.6 |
| Linksys WPC-300N | Broadcom Intensi-fi | 4.80.9.0 |
| Buffalo WZR-G300N | Broadcom Intensi-fi | 1.42 (1.0.37-1.07-1.03) |
| Buffalo WLI-CB-G300N | Broadcom Intensi-fi | 4.80.9.0 |
| Netgear WNR854T | Marvell TopDog | 1.1.05NA |
| Netgear WN511T | Marvell TopDog | 2.1.0.3 |
| Netgear WPNT834 | Airgo Gen 3 | 1.0.41 |
| Netgear WPNT511 | Airgo Gen 3 | 2.0.2.8 |
In each case, I checked the manufacturer’s website and downloaded and installed any newer firmware that I found. I should note that the only updates I found were for the Linksys WRT-300N and Netgear RangeMax 240 routers.
Also of note is the situation that I found with the Buffalo product. After I ran the tests on the Azimuth system, I received review samples directly from Buffalo. I found that the 4.80.17.0 driver supplied on the CD was newer than the 4.80.9.0 driver that came with the retail-purchased product. I then checked the Buffalo download site, but did not find the driver posted.
When I checked with Buffalo, I was told that the driver that I received was now included in currently shipping product and was available by calling Buffalo customer support. After further discussion, Buffalo ended up posting the new drivers for download the same day we spoke.
Test Results
Best Case Throughput
For each AP/STA pair, once the products were connected into the Azimuth system, I started by running the IxChariot throughput.scr script with TCP/IP and the file size changed to 1,000,000 Bytes from its default of 100,000. I then ran multiple tests to get a feel for how each product behaved.
I ran separate upstream and downstream tests and in the case of the products that had only 10/100 switches, ran tests using two wired clients. But I settled on using simultaneous up and downstream test runs with 0 dB attenuation to test the maximum throughput of each product.
The Azimuth system also has inherent path loss, even though it uses direct cable connection, but it is usually small enough that some signal attenuation must be used so that receivers under test are not overloaded. The test configuration I used had 44 dB of fixed attenuation before any programmable attenuation was applied. So the 0 dB attenuation referred to above is referenced to the fixed system attenuation.
Note: An AP and STA sitting 5 or 6 feet apart in open air will have around 40 dB of signal attenuation between them. This is referred to as Path Loss.
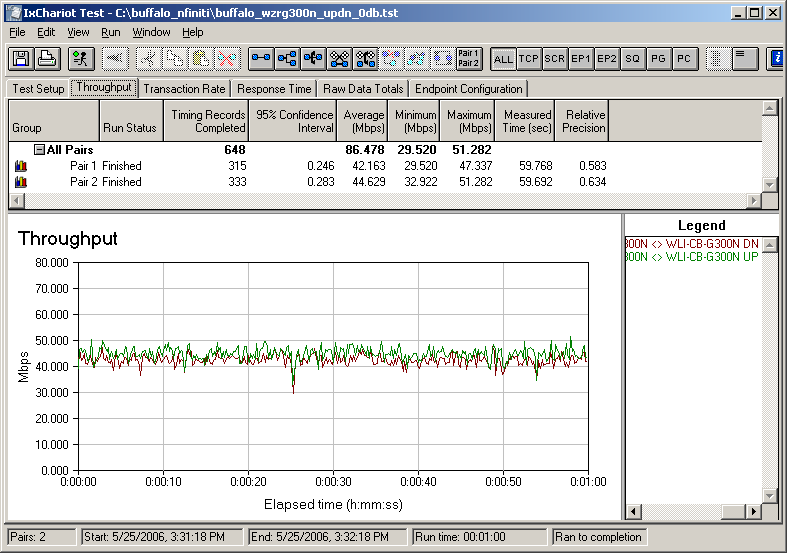
Figure 12: Buffalo Infiniti 0 dB Uplink/Downlink Throughput
Figures 12 and 13 show the maximum throughput of the Buffalo Infiniti and Linksys Wireless-N product pairs. Although both are based on Broadcom Intensi-fi silicon, the Buffalo products averaged only 86 Mbps, while the Linksys just barely tops the 100Mbps mark at an average total throughput for both up and downstream of 101 Mbps.
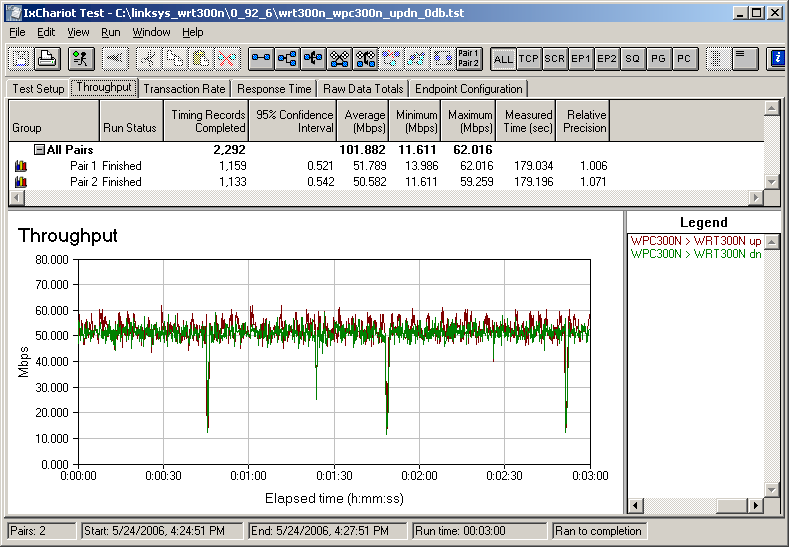
Figure 13: Linksys Wireless-N 0 dB Uplink/Downlink Throughput
Best Case Throughput, Continued
The Netgear RangeMax Next Gigabit Edition pair also made it into the 100 Mbps total throughput club, but just barely at 100.2 Mbps. The Marvell TopDog based products also displayed much higher throughput variation than the Broadcom Intensi-fi-based products.
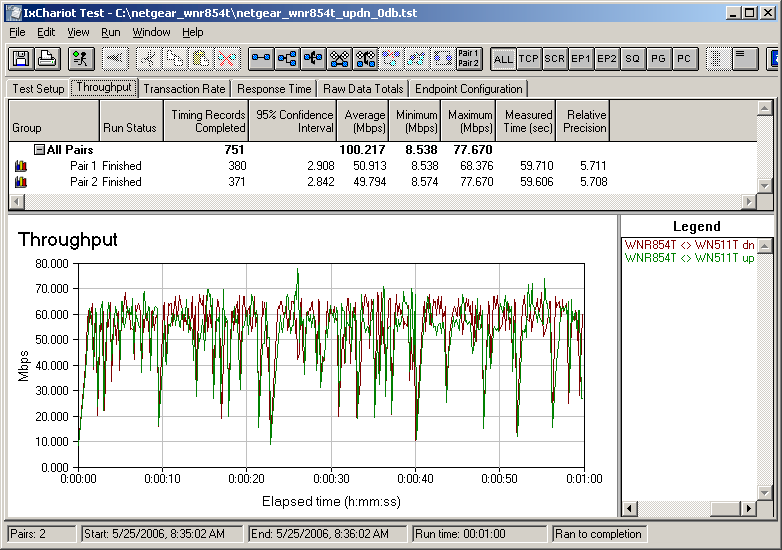
Figure 14: Netgear RangeMax Next Gigabit 0 dB Uplink/Downlink Throughput
Finally, I ran the RangeMax 240 product pair, which uses Airgo Gen 3 silicon to see how the results would line up with those I obtained with the open-air measurements I had previously taken.
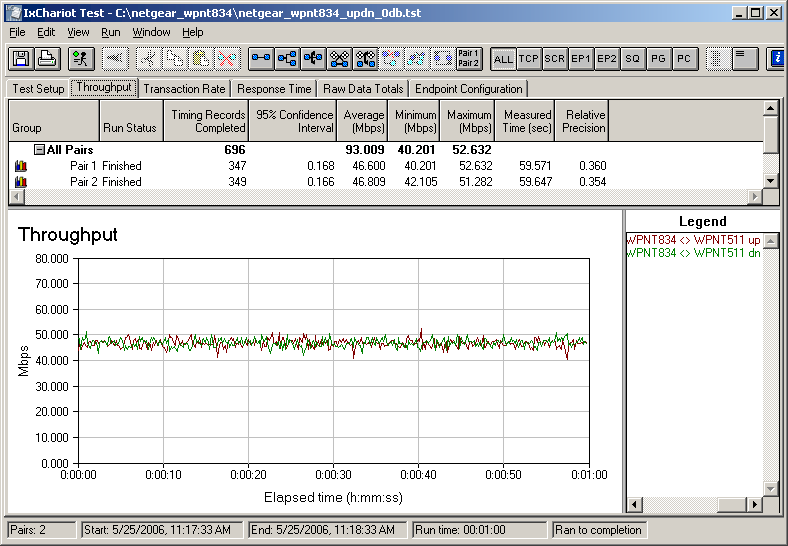
Figure 15: Netgear RangeMax 240 0 dB Uplink/Downlink Throughput
The results aren’t apples-to-apples because the Figure 15 results use newer router firmware and my previous results reflected total downlink throughput to two wired clients instead of a single client upstream / downstream. At any rate, the RangeMax 240 results this time came in at 93 Mbps total average throughput.
Downstream Throughput Vs. Range
The real value of the Azimuth system is its ability to automatically perform throughput vs. range tests with as little as 1 dB attenuation increments in a RF-quiet test environment. Think of this as the ability to change the distance between a STA and AP in very small, repeatable steps with no interference from other wireless LANs, microwave ovens, etc. What results is the ability to see what the products themselves are doing without environmental effects.
For the sake of brevity, I’m going to condense a lot of testing into a few very interesting plots. Figure 16 shows a comparison of Airgo Gen 3, Broadcom Intensi-fi and Marvell TopDog downstream throughput vs. range using the Netgear RangeMax 240, Linksys Wireless-N and Netgear RangeMax Next Gigabit products respectively.
These plots were created using an Azimuth MIMO Rate vs. Range script that interfaced with IxChariot to generate the data traffic and the Azimuth system to control signal attenuation. The test used the same modified IxChariot throughput.scr script that I used to generate the 0 dB max throughput plots. Each data point in the following plots represents the average throughput value measured by IxChariot from a 5 second test run. The tests also used a 5 second pause between changing the attenuators and starting the IxChariot run.
Keep in mind that since these plots represent a single data stream, you won’t be seeing the maximum throughput rates we saw earlier in the IxChariot plots. Instead, we’re looking to see what happens to throughput as we attenuate the signal level in 1 dB steps, to simulate increasing distance between AP and STA.
The Buffalo Nfiniti is not included in Figure 16 because I couldn’t get it to operate reliably downstream. I had a difficult time keeping the STA associated with the AP, and when I could get a run started, it would quit with around 60 -70 dB of path loss.
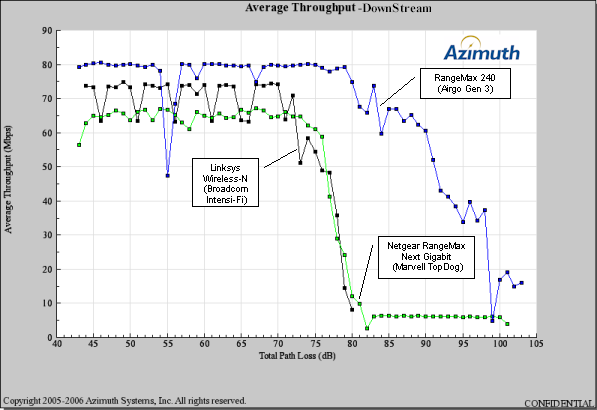
Figure 16: Downstream Rate vs. Range comparison
The significant points from Figure 16 are:
- The Linksys Wireless-N appears to be unable to make the shift to 802.11g rates. This is confirmed by Figure 17, which shows the link data rates reported by the Linksys client driver.
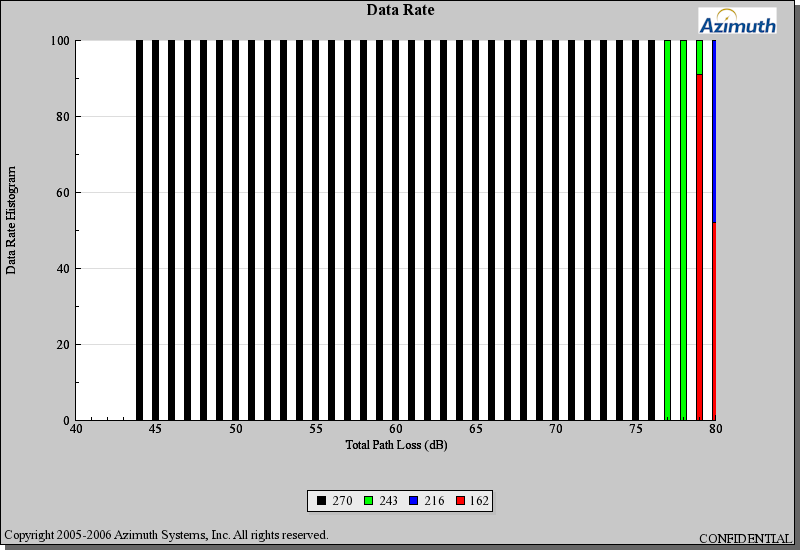
Figure 17: Linksys Wireless-N Reported Data Rate vs. Range
- Both the Marvell and Broadcom-based products shift down from maximum rates sooner and more quickly than the Airgo Gen 3 based product.
- The Marvell-based product appears to have better rate adaptation and can shift both to 802.11g and even 11b rates as shown in Figure 18.
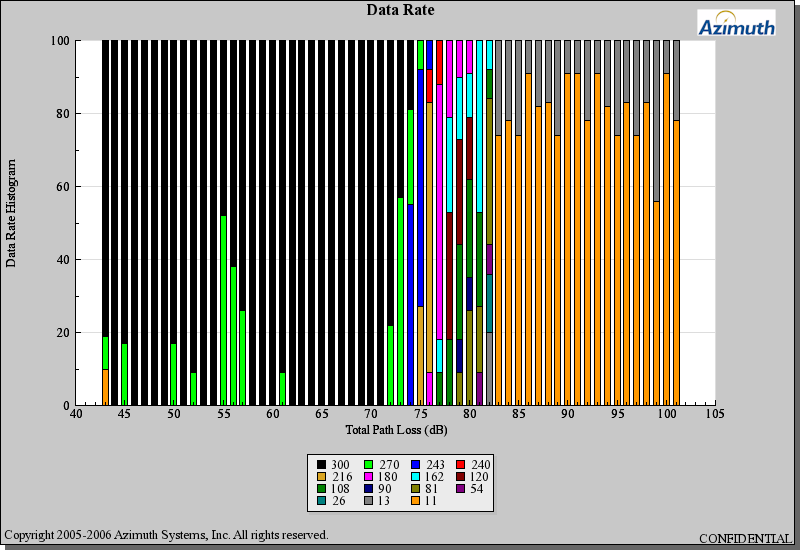
Figure 18: Netgear RangeMax Next Gigabit Data Rate vs. Range
Upstream Rate Vs. Range
I had more luck getting the Buffalo Nfiniti to run upstream, so included it in Figure 19. You can see that the Buffalo quits pretty quickly after it drops throughput. Although the Buffalo card driver always reported a 270 Mbps link rate, the plot sure looks like a rate shift took place.
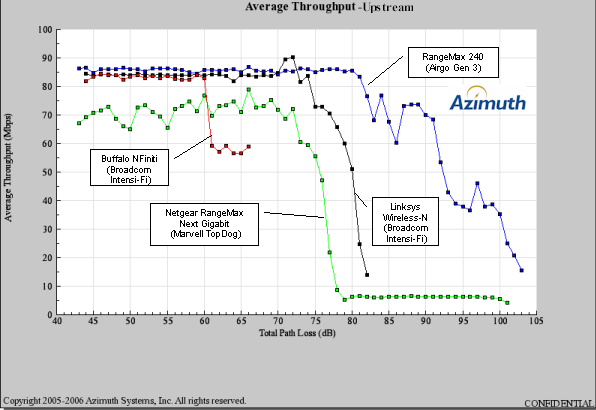
Figure 19: Upstream Rate vs. Range comparison
The same key points we saw in the downstream tests, however, still appear to hold true for upstream. In the end, the RangeMax 240 / Airgo Gen 3 pair maintains higher throughput for longer than any of the draft 11n products.
Does Draft 11n Beat 11g?
Since I had an 11g AP and card handy, I decided to run it through the Azimuth test and compare it to both the draft 11n and Airgo Gen 3 products. Figure 20 is, as they say, the “money shot” and speaks volumes about the current state of draft 11n products based on both Broadcom and Marvell chipsets.
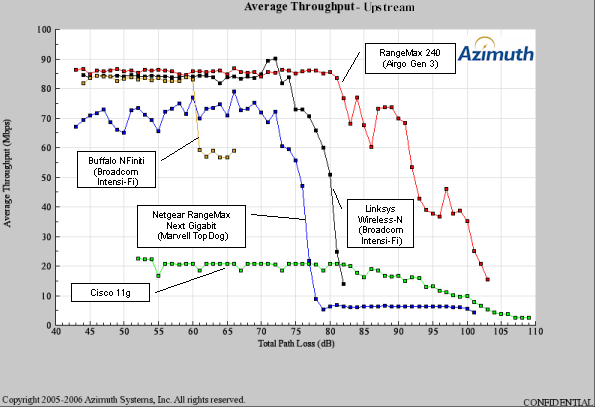
Figure 20: Upstream Rate vs. Range Compared to 802.11g
You can see that the only product that has a rate vs. range curve better than the 11g pair tested is the RangeMax 240 (Airgo Gen 3). Both Broadcom-based products’ throughput fall off eariler than the Airgo and fail to transition to lower link rates so that they can stay connected. The Marvell-based Netgear Next does manage to transition to lower link rates and stay connected, but at a throughput lower than that provided by the 11g pair.
The 802.11g products used were a Cisco Series 1200 AP (Air-1232AG-A-K9) and AIR-CB21AG-A-K9 client card. The “Cisco 11g” trace in Figure 20 is actually the average of 20 runs taken overnight to check the repeatability of the Azimuth system. Figure 21 shows an overlay plot of all 20 runs, which shows a repeatability far exceeding anything possible with open-air testing.
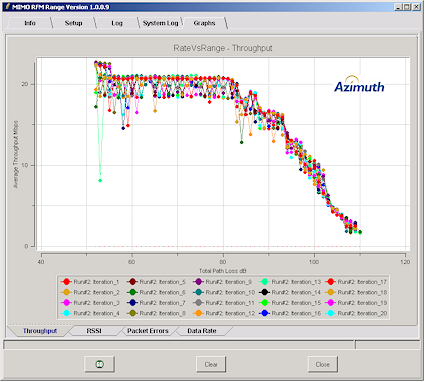
Figure 21: Cisco 11g upstream repeatability study
Closing Thoughts
I suspect that the validity of my results may be questioned by any or all of the manufacturers of the chipsets and products tested, since the configuration of Azimuth’s system that I used doesn’t simulate multipath, which MIMO technology depends on to work some of its magic. Azimuth’s Channel Emulator (ACE) does provide this capability, but for the sake of simplicity (and due to limited time) I decided to not use it for this round of testing.
As a result, I can’t say that these results represent the ultimate “truth”…if there is such a thing in WLAN testing! What I can say, however, is that the tests put all products into an RF environment quieter and more repeatable than that used by any other published reviews. The Azimuth system produced repeatable results that allowed me to observe detailed product performance characteristics that other test methods could never hope to provide.
That said, what’s the bottom line? Well, contrary to my previous tongue-in-cheek article, I have to join the chorus and advise against buying draft 11n products at this time. With high prices, immature drivers and firmware, no guarantee of upgrade to standard 11n when it’s released and now – shown for the first time – evidence that some current products doesn’t even perform better than 802.11g at lower signal levels, I can’t think of an upside that justifies the expense and hassle.
In spite of vendor claims to the contrary, draft 11n has a long way to go until it gets to a maturity similar to what 802.11g had when draft 11g products started to ship. The industry and consumers would be better served if the manufacturers went back to their labs and standards meetings, hammered out the details and bugs and re-launched these products in dual-band form when they were really ready to ship.
And this “don’t buy” includes Airgo Gen 3 products, too, since my testing didn’t reveal any sign that Airgo has fixed their “bad neighbor” problem with legacy 11b and g products operating on Channel 6. More on that, and the results of interoperability and neighboring WLAN testing can be found in Part 2.