Introduction
Our new wireless performance test method using Azimuth’s ACE 400NB Channel Emulator provides the most detailed look at wireless throughput vs. range performance that you’ll find anywhere. Our Wireless Charts plot throughput vs. path loss, which relates speed to signal level. However, most purchasers of wireless gear really want to know how a product will perform over distance, which is not directly provided by our charts.
The actual performance range of a wireless LAN product depends on many factors—too many to provide a simple conversion from path loss to range. But what we can do is relate signal loss to range for a specific environment, which will help provide some feel for what the Throughput vs. Path Loss plots mean for real-world performance.
The basic approach taken is to measure signal strength in multiple test locations, convert the signal strength to relative signal loss and then overlay the results onto throughput vs. path loss plots.
Test Environment
The test environment is a 3300 square foot two-level home with 2×6 wood-frame exterior walls, 2×4 wood-frame sheetrock interior walls, and metal and metalized plastic ducting for the heating and air conditioning system.
Figure 1 shows a simplified layout of the lower level and two of the five test locations. Figure 2 shows the upper level layout and the other three test locations. Table 1 provides distance and materials details of each location.
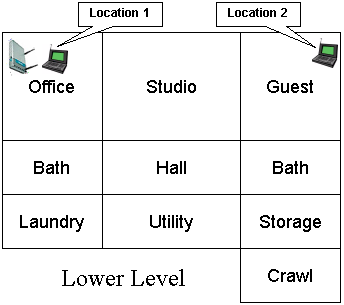
Figure 1: Lower Level Test Locations
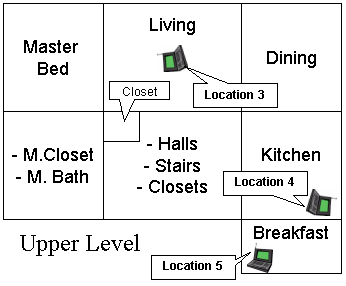
Figure 2: Upper Level Test Locations
| Test Location | Description |
|---|---|
| Location 1 | AP and wireless client in same room, approximately 3 feet apart. |
| Location 2 | Client in room on same level, approximately 45 feet away from AP. Two sheetrock walls between AP and Client. |
| Location 3 | Client in upper level, approximately 25 feet away (direct path) from AP. One wood floor, sheetrock ceiling, no walls between AP and Client. |
| Location 4 | Client on upper level, approximately 55 feet away (direct path) from AP. Two to three interior walls, one wood floor, one sheetrock ceiling and stainless-steel refrigerator, between AP and Client. |
| Location 5 | Client on upper level, approximately 65 feet away (direct path) from AP. Four to five interior walls, one wood floor, one sheetrock ceiling, between AP and Client. |
Table 1: Test Location Description
Measuring Signal Strength
I considered a number of tools for measuring signal strength before settling on NetStumbler. NetStumbler provides a nice signal strength vs. time plot that can easily be stopped when moving between locations. It also has pretty good WLAN chipset / card support, including the two cards that I wanted to use: the D-Link WNA-2330 (Atheros based) and Linksys WPC54G (Broadcom based).
WLAN cards aren’t the most accurate signal meters around. But they are good enough for what we’re trying to do because we need only relative signal strength. I started by using the D-Link WNA-2330 card associated with a Linksys WRT54G wireless router. I didn’t run any traffic—these measurements were made using the WRT54G’s beacons only.
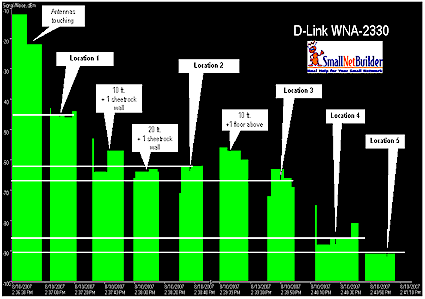
Figure 3 shows signal strength vs. location for my five test locations, plus a few others that are described in the figure callouts.
Figure 3: Signal Strength vs. Location – D-Link WNA-2330 card
Note that the largest signal drop occurs between the first two measurement points—"Antennas touching" and Location 1 (about 3 ft. away). Since RF power follows the inverse-square law, you can see that we’re dealing with very low levels of energy pretty quickly as we move away from the access point.
Table 2 takes the Signal Level readings from Figure 3 and relates them to an equivalent path loss, which is then overlaid on a downlink throughput vs. path loss plot for the card in Figure 4.
| Test Location | Signal Level (dBm) | Delta | Equiv. Path Loss |
|---|---|---|---|
| Location 1 | -45 | 46 | 60 |
| Location 2 | -62 | 29 | 77 |
| Location 3 | -66 | 25 | 81 |
| Location 4 | -85 | 6 | 100 |
| Location 5 | -91 | – | 106 |
Table 2: D-Link WNA-2330 Signal Levels
This is simply done by taking Location 5 as a reference and assigning it to the last plotted point. The last point is used as the reference instead of Location 1 because it’s easy to tell when you lose signal. The values in the Delta column in Table 2 are then subtracted from the Path Loss value of the last plotted point to get the path loss values for the other Locations.
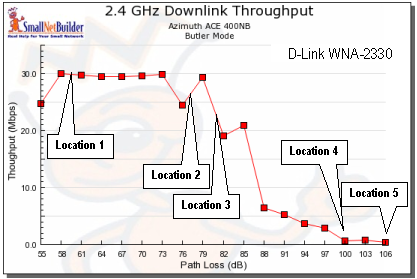
Figure 4: Path Loss vs. Location – D-Link WNA-2330 card
Figure 4 shows the results, with the locations overlaid on a downlink throughput vs. path loss plot.
Second Example
Since WLAN cards only measure RSSI, and chipset manufacturers use different formulas for converting RSSI to signal strength, I wanted to try a second card as a sanity check. I chose a Linksys WPC54G V3 card, which uses a Broadcom 54G chipset. I once again associated it with the Linksys WRT54G and made my rounds running NetStumbler in a notebook, using the WPC54G as my WLAN card.
Tip: There is a short discussion about RSSI and its conversion here on the MadWiFi wiki. Be sure to download the WildPackets WhitePapers from the "original location links" for even more on this topic.
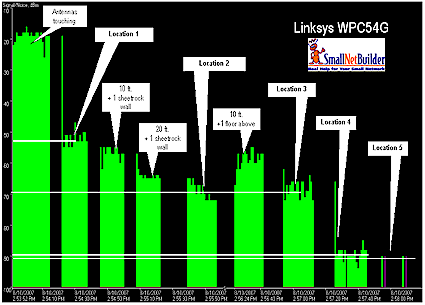
Figure 5 shows signal strength vs. location for my test locations, this time for the WPC54G card.
Figure 5: Signal Strength vs. Location – Linksys WPC54G card
Table 3 takes the Signal Level readings from Figure 5 and relates them to an equivalent path loss, which is then overlaid on a downlink throughput vs. path loss plot for the card in Figure 6.
| Test Location | Signal Level (dBm) | Delta | Equiv. Path Loss |
|---|---|---|---|
| Location 1 | -52 | 39 | 70 |
| Location 2 | -69 | 22 | 87 |
| Location 3 | -69 | 22 | 87 |
| Location 4 | -89 | 2 | 107 |
| Location 5 | -91 | – | 109 |
Table 3: Linksys WPC54G Signal Levels
The Path Losses and locations don’t match up in terms of dB. But they are surprisingly similar in terms of where they land on each plot’s curve. Location 1 is, of course, on the flat area at the beginning of the curve, Locations 2 and 3 in the middle near the "waterfall" and Locations 4 and 5 in the low-throughput "tail".
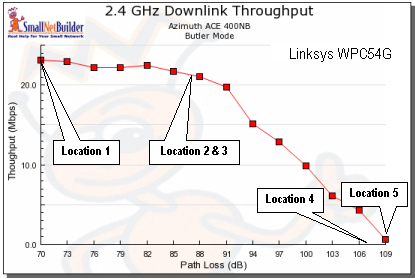
Figure 6: Path Loss vs. Location – Linksys WPC54G card
While by no means perfect, these examples should give you some idea of how to relate path loss to distance or signal coverage in a residential environent. Please note that if your environment has heavy interference from neighboring wireless LANs, your effective range will be significantly reduced.

