Introduction
| ZyXEL ZyAIR G-2000 802.11g Wireless 4-port Router | |
|---|---|
| Summary | 802.11g router with WPA support, but not WDS |
| Update | None |
| Pros | • Supports WPA • Supports EAP and RADIUS • Rich feature set with many user-configurable options • Configurable via web and Telnet command line interface |
| Cons | • Mediocre wireless performance • Web interface needs polish • Firewall feature difficult to configure |
The ZyAIR G-2000 is ZyXEL Communications’ latest IEEE 802.11G (and 802.11B) broadband wireless sharing router and gateway. The ZyAIR G-2000 is unusual in that it has a number of interesting features and a great deal of configuration flexibility that help it to stand out from the increasingly crowded field of consumer-grade wireless routers.
As an Internet gateway, the ZyAIR can share an Internet connection (such as a cable or xDSL connection) with multiple computers, allowing a home or business network to connect simultaneously using wired and wireless networking. The ZyAIR also provides secured wireless connectivity to your wired network with WPA (Wi-Fi Protected Access), which improves on WEP, virtually eliminating the security concerns early wireless had with hack-prone WEP connections.
The ZyAIR also employs MAC address filtering, which adds an additional layer of security by restricting who can connect to the wireless router to machines that have had their network card’s hardware address previously registered with the wireless router.
Finally the ZyAIR G-2000 supports a number of other authentication and connection schemes that make it a very flexible router / gateway for business or home networks. With a rich feature-set and a user’s guide that runs over 400 pages, ZyXEL has not skimped on the G-2000.
Basic Features
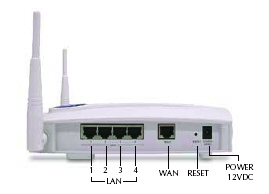
Figure 1: ZyAIR G-2000 with 4-port switch and WAN port
Along one side of the ZyAIR G-2000 there are four 10/100 switched LAN ports and a single 10/100 WAN port. While the user’s manual notes you can connect up to four computers to the LAN ports, if your network is bigger than four computers, you will most likely be connecting it to another switch. The LAN ports are auto-negotiating and auto MDI / MDI-X (automatically adjust to either a crossover or straight-through Ethernet cable).
If you get completely flummoxed by a configuration snafu, there is a Reset button recessed into the side panel that resets the unit to its factory default password and IP address. Although the reset button can not be accessed easily, it does reset the administration password, so this may be a good reason to mount the G-2000 out of reach ( it comes comes with a mounting bracket and the necessary hardware).
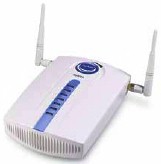
In addition to the LAN and WAN ports there are two other distinctive features. The first is the pair of antennas that make the G-2000 look a bit like a small sleek white version of everyone’s favorite movie ogre, Shrek. The antennas are connected using two RP-TNC style connectors to the body of the unit, and the jointed dipoles are moveable.
The other distinctive feature are the easy-to-read status lights on the top (or if wall mounted, front) of the unit. The status lights indicate power, system status, and the usage of the LAN and WAN ports. Also included is a large blue well-illuminated ZyAIR logo, which can be used indicate wireless data transmission or double as a night light.
Internal Details
Figure 2 shows a look under the hood. You can see the blue LED that illuminates the ZyAIR logo and also “breathes” (dims and brightens) to show traffic flow. One of the four LAN ports and the WAN port is illuminated with the yellow LEDs. The LAN port LEDs indicate connection health and activity. The two green LEDs that show system status and power.
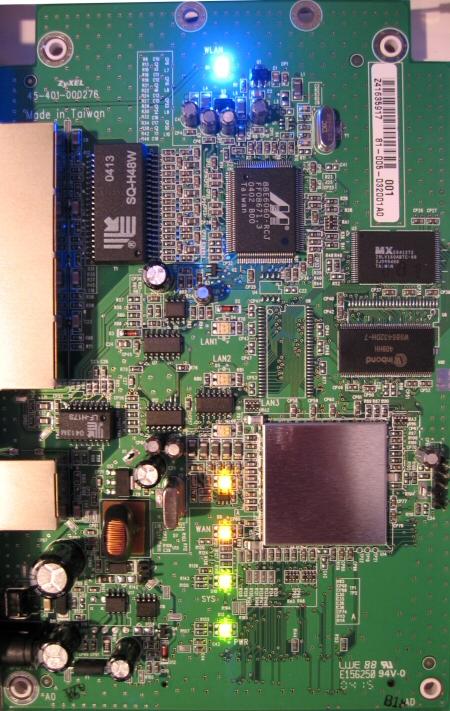
Figure 2: ZyAIR G-2000 mainboard
The G-2000 uses a Conexant PRISM-based ZCom XG-601 mini-PCI radio that’s mounted on the underside of the board.
Setup and Administration
For most of us, using a web interface may be preferable to using a command interpreter, and the G-2000 allows us to use either. Non-Windows users will rejoice at a consumer priced router with a command line interface. The rest of us will either enter information directly into the browser-based interface. With the web interface or the command line you can manually set up the ZyAIR, entering system name, WAN connection type, and enabling DHCP.
But if you prefer to use a setup wizard, ZyXEL provides its “Web Configurator”. The Web Configurator makes configuring the ZyAIR a relatively straightforward process.
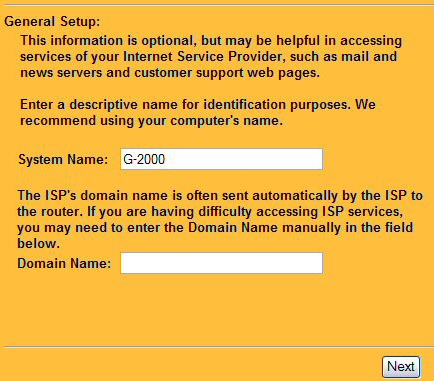
Figure 3: Web Configurator showing the first step of ZyAIR setup
After choosing a System Name, the wizard steps you through setting the G-2000’s channel, ESSID and WEP encryption (more later). I like that the ZyAIR allows WEP keys to be entered in either ASCII or in hexadecimal notation, depending on your level of geekyness.
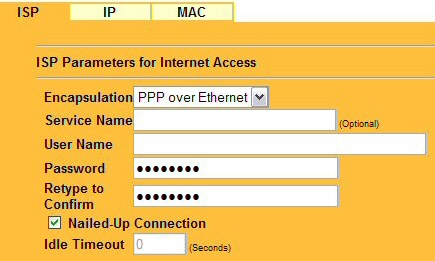
Figure 4: PPPoE is painless. The “Nailed-Up” connection works as a ‘keep-alive’
The Configurator then guides you through setting up the WAN interface to your ISP (Figure 4). In my case I selected PPPoE (PPP over Ethernet) and entered the user ID and a password that has been supplied to me by the telephone company when they set up my DSL connection. I also selected the “Nailed-up Connection” check box, which performs the same function as the “keep alive” function found on other products.
Finally, the Configurator asks you to select how you want to get an IP, either manually or automatically. I chose to let my ISP supply both the IP address used by the WAN interface and the DNS servers to use for address lookups. I also left the MAC address spoofing untouched, though ZyXEL strongly recommends that you at least spoof the MAC address of the computer you are using to set up the access point. The MAC spoofing can be automatically done for you with by selecting the spoof MAC option.
Note that if you have previously set up the unit manually, the Configurator will display the values you entered previously.
Setup and Administration, Continued
There is no such thing as being too secure and the ZyAIR G-2000 has added some important security features (such as support for WPA). Yet despite its advanced features, ZyXEL has committed an error in judgment when it comes to administrative access. For the sake of ease-of-use, the administrative interface defaults to being accessible by both wired or wireless users. Web access to the Remote Management interface can be locked down to a specific IP address, but not to MAC addresses.
But the real concern is that there is no account name for the administrative user, leaving only a password standing between attempted access and actual access itself. Realizing the weakness inherent in static passwords, ZyXEL has provided a protection mechanism to help discourage brute-force password guessing attacks. This mechanism allows you to specify a wait-time that must expire after three failed login attempts (up to 60 minutes, with the default at 3 minutes) before a fourth password attempt is allowed. Of course, you may also find yourself locked out for a bit by someone attempting to guess passwords.
As for the mechanics of changing the brute force time-out, there is no way to do this through the web interface. To change the brute force wait time requires Telnetting into the ZyAIR and starting the command interpreter and entering the command using the proper syntax. The manual is not completely clear how this is done, however.
Firewall Features – Multi-NAT
The ZyAIR G-2000 employs a NAT plus SPI (Stateful Packet Inspection) firewall with DoS (Denial of Service) protection. The ZyAIR firewall also supports TCP/UDP inspection, real time alerts, reports and logging. Configuring firewall rules is a bit like playing the game “Operation” where you try to extract the bits you don’t want without killing the patient. Therefore I respect this little notice in the ZyAIR documentation:
If you configure firewall rules without a good understanding of how they work, you might inadvertently introduce security risks to the firewall and to the protected network. Make sure you test your rules after you configure them.
Yes, many a good day has been spent trying to diagnose a good firewall gone bad.
The ZyAIR’s firewall has built-in support for multiple types of NAT, including One-to-One, Many-to-One, Many-to-Many Overload, Many One-to-one, and Server. However, these multi-NAT features are useful only to users who have more than one IP from their ISP, and allow multiple copies of a specific server type – HTTP for example – to be hosted through the G-2000.
Most users, though, will use the ZyAIR’s SUA (Single User Account) feature to expose a LAN-based server through the G-2000’s firewall. SUA supports the forwarding of single ports or port ranges.
Firewall Features – Service Blocking
The ZyAIR G-2000’s firewall interface is not the easiest to navigate for a novice when it comes to blocking services (also known as port filtering) but does include dozens of pre-created firewall services ready for blocking.
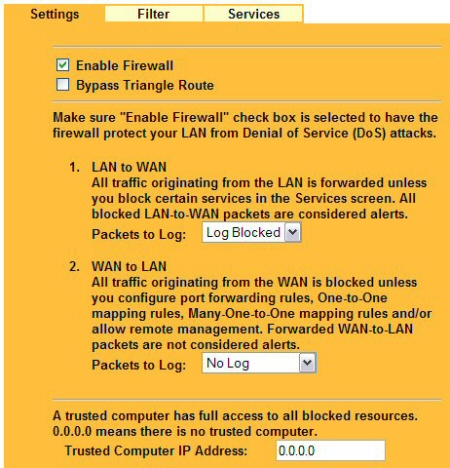
Figure 5: Enable Firewall, log traffic, and specify an IP that can bypass firewall blocks
Selecting a service to block is as simple as selecting the service name and clicking ADD (Figure 6). The result will be that the service (say, PING) will be blocked (dropped silently) from traversing the WAN, inbound to the LAN. Note that the web-interface does not provide the ability to selectively block specific IP addresses or perform directionally specific blocks.

Figure 6: Enable Services Blocking using predefined services, custom services, and block by time
Firewall Features – Content Filters
Basic URL blocking and blocking web content based on keywords are also available (Figure 7). The blocked services and web-filtering on keywords can be configured to work around the clock or during a specified time period on days that you select.
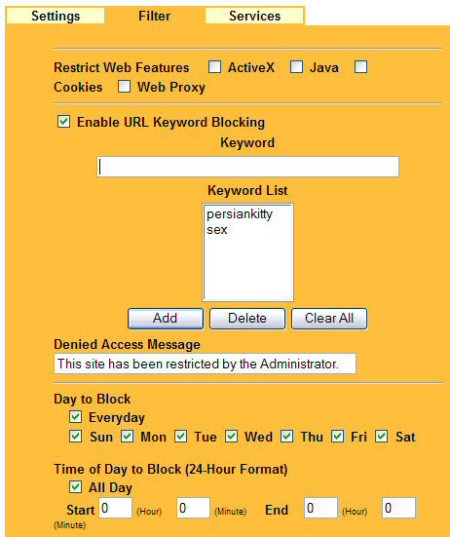
Figure 7: Restrict forbidden websites by data and time.
The bottom line is that if you require a serious (i.e. enterprise-grade) firewall at the perimeter of your network, consider buying a dedicated firewall. However, if you are just looking for basic filtering and blocking, the ZyAIR G-2000 can help limit the exposure of your network to the casual hacker. But there are other routers in the same class as the ZyAIR that have much better firewall interfaces.
VPN
The ZyAIR supports PPTP, L2TP and IPsec pass-through from LAN clients and the SUA feature will allow you to make all three types of VPN servers on the LAN side accessible from the Internet.
ZyXEL highlights the G-2000’s support for SSL pass-through, but the capability to support secure connections should be (and is) standard on every consumer router.
Logging and Alerts
Onboard logging (Figure 8) is somewhat limited, but the G-2000 supports sending event logs to a syslog server. Enabling syslog is as simple as entering the server name or IP address of the syslog server. If you don’t have a syslog server set up on your network, you can also have the ZyAIR mail logs and event alerts to a single email address that you can specify.
Logs can scheduled for delivery and include more than a dozen loggable categories: from system maintenance and system error logs to logs of attacks and blocked website attempts. Alert categories include system errors, access control, blocked web sites, blocked mobile code, and attacks.
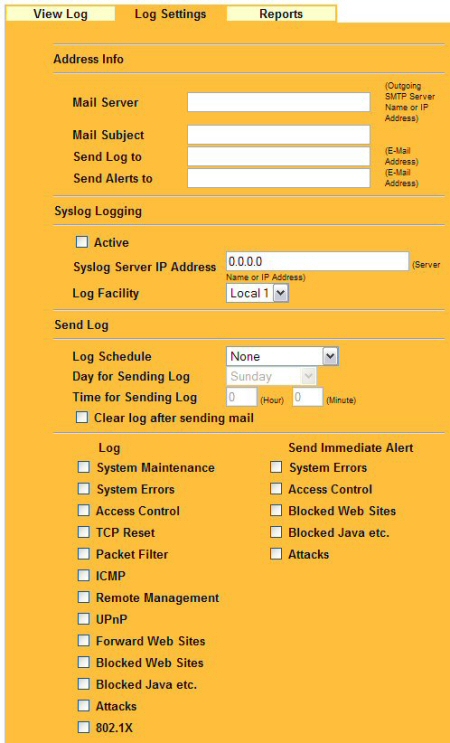
Figure 8: Log Settings and Alerting Options
Other Features
Other features that I haven’t previously mentioned are:
-
SNMP (Simple Network Management Protocol) support – The ZyAIR supports SNMPv1 and v2, which allows a management application to access and monitor the ZyAIR through the network.
-
Dynamic DNS Support – This feature allows accessing services on your LAN using an Internet-friendly name (such as ftp.scottsbigfileserver.com) even though you have a dynamically changing IP address provided on loan from your phone or cable company.
Although Figure 9 shows a drop-down box in the service provider field, DynDNS.ORG is the only option. DynDNS supports three DDNS types: dynamic, static, and custom. Before activating this feature, check out the information at www.DynDNS.org.
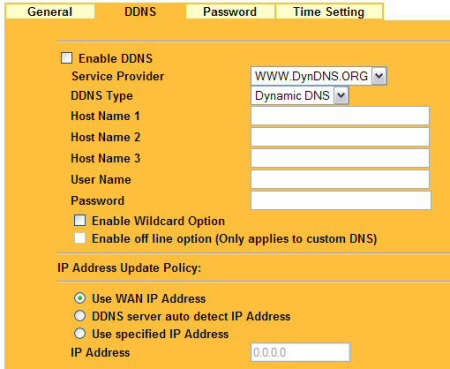
Figure 9: DDNS allows you to access your LAN using an Internet friendly name
-
Multicast Support – IGMP multicast Versions 1 and 2 (see RFC 2236) is supported. Multicast support will not impact most users, but if you are planning on watching (or hosting) specific types of streaming media that use multicast, you will be pleased that the ZyAIR supports it.
-
IP Aliasing and IP Policy Routing – IP Alias allows you to partition a physical network into logical networks over the same Ethernet interface. The ZyAIR supports three logical LAN interfaces via its single physical Ethernet LAN interface with the ZyAIR itself as the gateway for each LAN network.
IP Alias may be of interest to the corporate network administrator creating logical LANs and is beneficial for forcing traffic to pass through the ZyAIR to avoid the problems that arise with complex LAN architectures and asymmetric routing. The same class of prospective users will be happy to know that the ZyAIR also supports IP Policy Routing, which provides a mechanism to override the default routing behavior and alter packet forwarding based on the policies defined by the network administrator. -
Universal Plug and Play (UPnP) – Using the standard TCP/IP protocol, the ZyAIR and other UPnP-enabled devices can dynamically join a network, obtain an IP address and convey its capabilities to other devices on the network. I’ll have to take ZyAIR’s word on this, because I don’t have any other UPnP products on my network. Figure 10 shows that UPnP’s security-compromising NAT Traversal capability can be separately enabled
 TIP: See our UPnP NTK if you need more information on UPnP
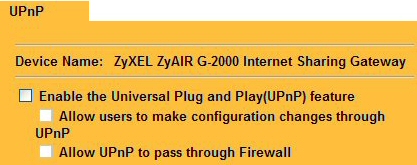
Figure 10: The G-2000 supports UPnP
Routing Performance
The results show consistent performance slightly below 16Mbps in both directions. This speed is typical of many current generation routers and should be plenty fast for most consumer and SOHO applications.
Routing Performance Test Results
| Test Description | Transfer Rate (Mbps) | Response Time (msec) | UDP stream | |
|---|---|---|---|---|
| Throughput (kbps) | Lost data (%) | |||
| WAN – LAN | 15.8 | 1 (avg) 1 (max) |
500 | 0 |
| LAN – WAN | 15.7 | 1 (avg) 2 (max) |
500 | 0 |
| Firmware Version | V 3.60(HI.1) | |||
See details of how we test.
Wireless Features
The ZyAIR’s wireless setup (Figure 11) features include the ability to disable the radio, set the ESSID (and also “hide”, or disable broadcast of it).
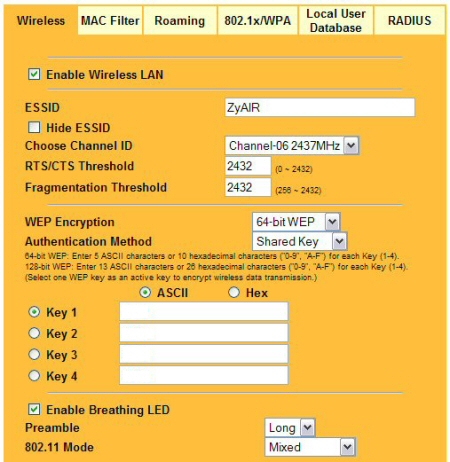
Figure 11: The ZyAIR supports WEP, ESSID hiding, and easy entry for WEP keys
You can see the other setup parameters in Figure 11, most of which you’ve seen before. Note that the G-2000 doesn’t support any form of 802.11g throughput enhancement.
The ZyAIR implements several security features that help keep wireless communications secure, such as supporting Wi-Fi Protected Access (WPA), 802.1x authentication and MAC address filtering.
WPA support includes both Pre-Shared Key (PSK) and “enterprise” (RADIUS) modes with TKIP. The optional AES encryption supported by some competitive products is not an option on the G-2000.
802.1x authentication uses a client-sever model that supports centralized user authentication and accounting – usually via a RADIUS server. The RADIUS server provides a single point of authentication, which is more robust and flexible than using static passwords or having to rely on MAC addresses. RADIUS also allows the use of several authentication schemes, including two-factor authentication and using tokens.
While the ZyAIR does not have an onboard RADIUS server, it is capable of passing on authentication requests to an external RADIUS server, which handles the authentication and accounting tasks.
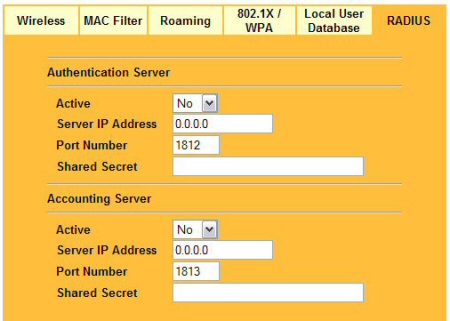
Figure 12: The RADIUS configuration tab – enter the IP of the RADIUS server and the shared secret key
In order to ensure network security, the access point and the RADIUS server use a shared secret key, i.e. password, that both know. The key itself is never sent over the network, but rather an MD5 hash. The ZyAIR supports EAPTLS, EAP-TTLS and PEAP authentication protocols with RADIUS.
Wireless Features, Continued
While EAP and RADIUS make for industrial strength authorization, if you do not already have a RADIUS server or do not wish to set one up, the G-2000 can perform EAP authentication using its Local User Database (Figure 13) for up to 32 users.

Figure 13: If you do not have a RADIUS server you can authenticate to an onboard Local User Database
The Local User Database performs a function similar to RADIUS, but is not a mini RADIUS server. Using either RADIUS or the Local User Database does require that authenticating clients support 802.1x, however.
Figure 13 shows that authentication requests can be directed to an external RADIUS server, the Local User Database (Figure 14), or both. With either method, users can be forced to periodically re-authenticate and / or re-authenticate if the user’s connection is idle for too long.
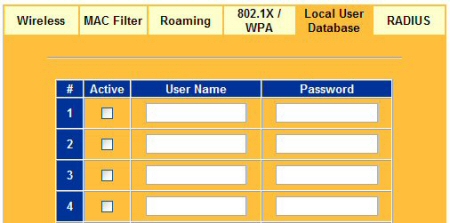
Figure 14: A Local User Database allows for simple authentication using only a name and password
The G-2000 also supports MAC address filtering (Figure 15), which uses client MAC addresses to control access to the G-2000’s LAN. The list can be set to either grant or deny access, but can’t be saved to or loaded from a file. The feature also doesn’t present a list of currently associated or in-range client MAC addresses to pick from in order to minimize setup hassles.
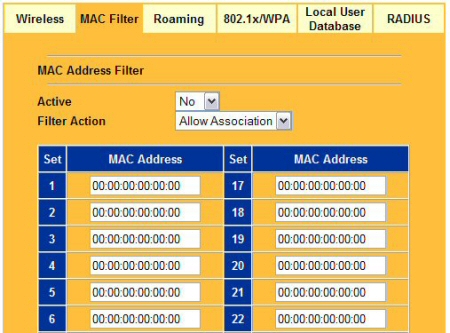
Figure 15: MAC address filtering provides basic client access control
Wireless Tests
802.11g wireless performance test results are presented in the table below:
|
Test Conditions: – WEP encryption: DISABLED |
Firmware/Driver Versions : AP f/w: V 3.60(HI.1) |
||||
|
Test |
Connection Rate |
TCP-IP Transfer |
Response |
UDP |
|
|
UDP Throughput |
Lost |
||||
|
Condition 1 |
54 Mbps |
15.7 |
1 (avg) |
500 |
0 % |
| Condition 2 |
36 Mbps
|
15.8
|
1 (avg)
1 (max) |
500
|
0%
|
| Condition 3 |
1-5 Mbps
|
7.5
|
2 (avg)
2 (max) |
485
|
0%
|
(Test setup details can be found here.)
Figure 16 is a Chariot screen snap after the completion of Test 1, which represents an ideal environment, with the G-2000 and client in the same room. Except for two brief drops, throughput is fairly constant at 15.7Mbps. This performance is typical of competitive products.

Figure 16: Chariot Test 1 (ideal environment, same room)
(click for larger image)
Test 2 is a typical environment where the client is 40 feet and a few walls away. Figure 17 shows a general slowdown in speed and more frequent sudden speed drops. The client showed that the connected rate had dropped to 36Mbps, but the actual throughput – 15.8Mbps – is no worse than Test 1.
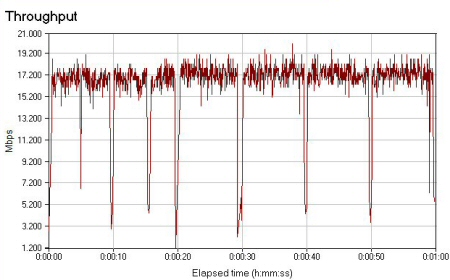
Figure 17: Chariot Test 2 (typical environment, separated by walls and moderate distance)
Test 3 represents a worst-case scenario with the client separated by some formidable barriers, such as brick work and earth that drastically diminish the signal. The connection rate bounced between 1 and 5Mbps and it took several tries just to find a location that didn’t drop the connection altogether. Figure 18 shows that Test 3 completed with an average transfer speed 7.5Mbps, which was higher than the connection rates shown by the client. You can also see that throughput variation was much higher than for Test 1 and 2.
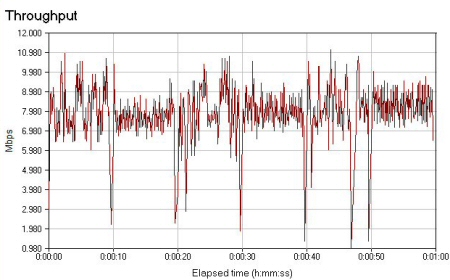
Figure 18: Chariot completes Test 3 (stressed environment, separated by a brick wall and earth)
Conclusion
The G-2000 gets overall high marks for its physical design. It has a great look and feel from the outside and feels solid – evidence of good industrial design.
Its dual adjustable antennas serve the unit well and the status lights are well placed and easy to read. A small negative is that the power supply plug could use a restraining clamp.
While it’s reasonably priced, some of the G-2000’s consumer-oriented rivals cost about half as much! So while the product’s ability to support WPA, EAP, RADIUS and particularly its built-in Local user authentication feature give it an edge on features, the G-2000’s price premium may be more than potential buyers are willing to bear.
Although its web interface could use some additional work – especially the firewall interface – the G-2000 was easy enough to set up set up that I didn’t have to resort to the manual just to get it working.
If ZyXEL can put as much polish into the web-interface as they have into the feature set and exterior design, they will have a stand-out product among a crowded field.
Wireless Testing Details
All tests were done using IXIA’s Chariot 4.3, build 1699. Test direction is from AP to client, using TCP/IP protocol and 1,000,000 Byte file size, looped for one minute.
Wireless Client is a Fujitsu Lifebook P-2000 running Windows XP SP1 with 512 MB RAM and Intel Pentium M 900 Mhz
Ethernet Client is a Dell Inspiron 8600 running Windows XP SP1 with 512 MB RAM and Intel Pentium M 1.7 Mhz
Condition 1 : Same room
Distance between G-2000 and wireless client is under 10 feet.
Condition 2: Moderate distance
Wireless client moved approximately 40 feet away, transmitting through two sheet rock walls.
Condition 3: Worst case
Wireless client approximately 100 feet from AP, exterior to the structure containing the AP. The AP is shielded by a brick wall and earth, with the AP below the client.