| At a glance | |
|---|---|
| Product | Linksys Atlas Max 6E (MX8500) [Website] |
| Summary | Qualcomm-based tri-radio, four-stream 6E router with 5 GbE WAN port. |
| Pros | • 5 GbE WAN port • Four-stream front and backhaul radios • Clients can connect to 6 GHz radio |
| Cons | • Expensive • Poor mesh performance • 5 GbE port can’t be switched to LAN |
Typical Price: $0 Buy From Amazon
Introduction
I wasn’t exactly wowed by Linksys’ Hydra Pro 6E that I reviewed last month. Its 6 GHz performance was equal to its ASUS GT-AXE11000 and NETGEAR RAXE500 competition on downlink and around 400 Mbps higher on uplink. But its two-stream 2.4 and 5 GHz radios produced throughput far below the ASUS and NETGEAR and even most other Wi-Fi 6 routers I’ve tested.
This time, I’m looking at Linksys’ other 6E offering, the MX8500 Atlas Max 6E. At its heart is a tower-style, 6E, tri-band, fully four-stream design that Linksys just started selling as a single unit, for the same $500 that it’s asking for the Hydra Pro 6E (at least that’s how it’s currently listed on Linksys’ Store). But since Linksys shipped me a three-node mesh system, that’s how I’m reviewing it. It’s pity, however, since it’s a better router than the Hydra Pro for the same money. But I get ahead of myself…
The Product
The Atlas Max has the off-white tower-style design of Linksys’ Velop family, even though Linksys lists Atlas as a separate product family on its Whole Home Mesh WiFi System page. It’s a big boy, measuring about 4.5 inches on each of its sides and a half inch shy of 10 inches tall (113 mm x 113 m x 243 mm or 4.45” x 4.45” x 9.57” if you want to be exact).
Linksys takes its monolith styling seriously, providing only one LED as the only visual indicator. This is too spartan for my taste; at minimum, each Ethernet port should have a link/activity indicator.

Linksys MX8500 Atlas Max 6E LED callouts
The four switched 1 GbE LAN ports and single 5/2.5/1 GbE multi-Gig WAN port are on one of the sides, along with a single USB 3.0 port for storage sharing and 12v power jack for a pretty good sized wall-wart power supply to plug into.

Linksys MX8500 Atlas Max 6E port and switch callouts
Linksys has the FCC innard photos locked up for awhile and since the sample must ship back to Linksys, I didn’t open it up. But Linksys shared that the Atlas Max is based on Qualcomm’s Networking Pro 1210 system, which is reflected in the table below. The table includes the two previously-reviewed 6E routers and the NETGEAR Orbi Wi-Fi 6 mesh system I’ll be using for performance comparison later.
| Linksys MX8500 Atlas Max 6E | Linksys MR7500 Hydra Pro 6E | ASUS GT-AXE11000 | NETGEAR Orbi 6 RBK752 | |
|---|---|---|---|---|
| CPU | Qualcomm Networking Pro 1210 64 bit quad-core @ 2.2 GHz | Qualcomm Networking Pro 810 64 bit quad-core @ 1.8 GHz | Broadcom BCM4908 64 bit quad-core @ 1.8 GHz | Qualcomm IPQ8174 ARM54 quad core @ 1.4 GHz |
| Switch | Qualcomm QCA8075 (?) | Qualcomm QCA8075 | Broadcom BCM54991E | Qualcomm QCA8075 |
| RAM | 1024 MB | 512 MB | 1024 MB | 1024 |
| Flash | 512 MB | 512 MB | 256 MB | 512 |
| 2.4 GHz Radio | – Qualcomm 4-stream an/ac/ax radio | – Qualcomm 2-stream an/ac/ax radio | – Broadcom BCM43684 4-stream an/ac/ax radio – Skyworks SKY85216-11 2.4 GHz LNA (x4) ? – Skyworks SKY85006-11 2.4 GHz PA (x4) |
– Qualcomm QCN5024 4 stream AX -Skyworks FEM (x2) |
| 5 GHz radio | – Qualcomm 4-stream an/ac/ax radio | – Qualcomm 2-stream an/ac/ax radio | – Broadcom BCM43684 4 stream an/ac/ax radio – Skyworks SKY85743-21 5 GHz front end (x4) |
– Qualcomm QCN5054 4 stream AX -Qorvo FEM (x2) (same for 5 GHz high-band radio) |
| 6 GHz | – Qualcomm 4-stream 6E radio | – Qualcomm 4-stream 6E radio | – Broadcom BCM43684 4 stream an/ac/ax radio – Skyworks SKY85780 6 GHz front end (x4) |
N/A |
| Bluetooth | – Qualcomm | – Qualcomm | – Broadcom BCM43684 4 stream an/ac/ax radio – Skyworks SKY85780 6 GHz front end (x4) |
N/A |
| Price | $1200 (three node system) | $500 | $550 | $299 |
Table 1: Component summary
The Networking Pro 1210 system has three four-stream radios vs. the Networking Pro 810’s four-stream 6 GHz and two-stream 2.4 / 5 GHz radios. The Atlas Max also gets twice the Hydra Pro’s 512 MB of RAM. So the $500 price point makes no sense to me for both the Hydra Pro 6E and single Atlas Max 6E.
Features
I had my say about Linksys’ feature set in the Hydra Pro review. The TLDR is that it’s not one of the more feature-rich router OSes available. I quickly abandoned the Linksys app after I used it to add nodes to the system. But using the browser UI wasn’t that helpful either. If there is detailed information on how the mesh nodes are connected (band, channel, link rate, signal quality, configuration) it’s not obvious in either the app or UI.
I found you can get some insight into what the router is doing under the hood by emailing yourself a router diagnostic report. Just click the Share router info with Linksys button on the Troubleshooting page, wait for the "generating details" spinner to populate the pop-up window and enter your email address. Within a few minutes you’ll receive an email with links to two reports. The first link downloads a basic metadata file detailing the log request. The second link downloads the log file. Both files are in plaintext, so open with your favorite text editor and enjoy! Although there is a lot of information in the log, it wasn’t obvious which of it described mesh operation.
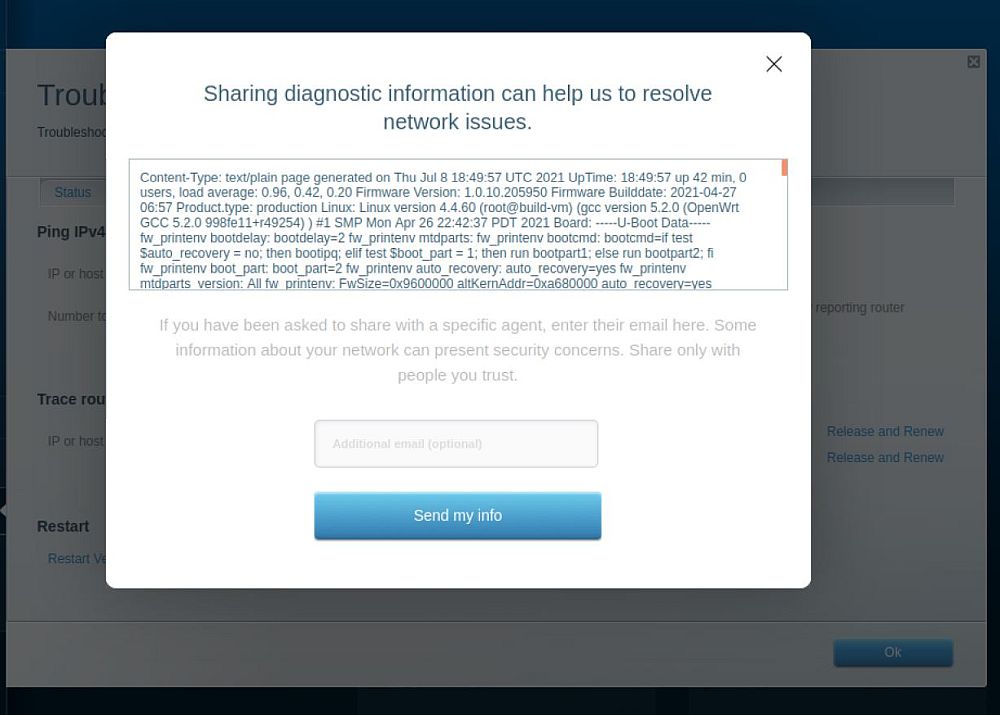
Linksys MX8500 Atlas Max 6E diagnostic
The Hydra Pro review has screenshots of the few screens of interest, so I won’t repeat those here. Even the advanced-wireless.html pages are the same. There are a few things of note, however, on the Wi-Fi side of things. First, the same 6 GHz band channels are supported as the Hydra Pro, starting at channel 33 and incrementing by 4 up to channel 229. Preferred Scanning Channels (PSC) mode is not supported, nor are the channels indicated, as they are in the NETGEAR RAXE500.
The main thing to note about the 6 GHz band is that it is not dedicated to backhaul. Linksys says the Atlas Max uses "dynamic backhaul". Here’s the explanation I received:
"The Atlas Max 6E system uses dynamic backhaul technology. This allows the system to intelligently choose the band that will provide the best connection between nodes for a stronger mesh network. In most cases, the system will prefer the 6GHz band because it has the least congestion and the highest bandwidth, but the system is not dedicated to a specific band, and can use either the 5GHz band or the 6GHz band for backhaul."
The good news is that 6 GHz is available for device connect. The bad is that your devices could be competing for backhaul bandwidth. Theoretically, with 160 MHz of 6 GHz bandwidth, there should be plenty to go around. And the 6 GHz radio does support 160 MHz channel bandwidth if you leave its Channel Width setting on Auto; there is no 160 MHz option on the dropdown. In fact, neither the 2.4 or 5 GHz Channel width dropdowns show the highest-available bandwidth. You’re supposed to know that 2.4 GHz Auto means 20/40 MHz and 5 GHz Auto means 20/40/80 MHz.
The last important thing to know about the Wi-Fi capability is that the 5 GHz radio supports neither 160 MHz bandwidth nor DFS channels.
Other Wi-Fi features are summarized in the table below.
| Wireless | |
| # of 2.4 GHz streams | 4 |
| # of 5 GHz streams | 4 |
| # of 6 GHz streams | 4 |
| # of Wi-Fi radios | 3 |
| Ethernet backhaul |
Y
|
| Wi-Fi Radio 1 | Qualcomm QCN9074 4 stream 6E (?) |
| Wi-Fi Radio 2 | Qualcomm QCN90744 stream 6E (?) |
| Wi-Fi Radio 3 | Qualcomm QCN9074 4 stream 6E (?) |
| Bluetooth Radio |
Y
|
| IoT Radio |
Y
|
| Antenna | Internal |
| FCC ID | K7S-03685 |
| WPS |
Y
|
| WPA3 |
Y
|
| OWE |
N
|
| RADIUS |
N
|
| Guest Network |
Y
|
| Roam Assist | 11kv |
| DFS |
N
|
And other router features are summarized here:
| Features | |
| Type | TriNode |
| # of Ethernet ports | 5 |
| 2.5G Port |
N
|
| 5 GbE port |
Y
|
| 10 GbE port |
N
|
| CPU | Qualcomm Networking Pro 1210 Quad Core @ 2.2 GHz |
| Switch | Qualcomm QCA8075 |
| RAM (MB) | 1024 |
| Flash (MB) | 512 |
| Firmware | 1.0.10.205950 |
| Cloud Service |
N
|
| Web Admin |
Y
|
| DHCP Reserve |
Y
|
| AP Mode |
Y
|
| Wireless Bridge |
Y
|
| Notes | Four 1 GbE switched LAN ports, one 5/2.5/1 GbE WAN port |
| WAN | |
| Static |
Y
|
| Dynamic |
Y
|
| PPPoE |
Y
|
| PPTP |
Y
|
| L2TP |
Y
|
| IPv6 |
Y
|
| QoS | |
| Type | Priority |
| Direction | Down |
| Auto |
Y
|
| Firewall | |
| Port Forward |
Y
|
| DMZ |
Y
|
| Content Filtering |
Y
|
| Rogue Device Block |
N
|
| Threat Protection |
N
|
| Internet Pause |
Y
|
| User Accounts |
N
|
| UPnP |
Y
|
| UPnP disable |
Y
|
| Notes | Content filtering limited to URL blocking |
The Tests
The Atlas Max is the first Wi-Fi mesh system tested with my brandy-new Version 2 Wi-Fi Mesh System test process. The V2 mesh process uses many of the tests from the Version 11 Wi-Fi Router test process, so we’re now testing both throughput and latency in the mesh. It also has a simple "capacity" test.
As with the new router benhmarks, I had to create a different set of Charts to use the new set of benchmarks. So all Wi-Fi 6 and 6E Wi-Fi mesh systems will be found in the Wi-Fi Mesh System Charts, Finder and Ranker. You can get to them all using the Tools link in the site navigation bar.
To have something to compare to, I also ran a NETGEAR RBK752 Orbi Tri-Band WiFi 6 Mesh System through the V2 benchmark suite. Since the Orbi has only two-stream fronthaul radios and a high-band 5 GHz four-stream backhaul configuration, it’s not an apples-to-apples matchup. The SKU tested is also only a two node system vs. the Atlas Max’ three. But it turned out the comparison produced some very interesting results.
Routing Benchmark Results
Every router tested before I paused reviews two years ago was fully capable of wire-speed gigabit throughput. So until manufacturers include > 1 GbE ports on both WAN and LAN, wired throughput testing is going to be pretty boring. Any differences you see in results are more due to test process variation than product performance. Keep in mind the best you’d ever see in this benchmark would be ~ 944 Mbps, not 1000 Mbps, due to TCP/IP overhead. While the Atlas Max’ throughput is slightly below the NETGEAR, I wouldn’t worry about the result. Note the NETGEAR has only 1 GbE ports.

Routing throughput results
The new benchmarks include router latency, which is generally pretty low. I’m showing only 90th percentile values that come right from the betterspeedtest.sh script used for wired router performance benchmarking, even though you can also see the average reported value in the charts. Latencies are converted to "scores" because the Ranker always ranks values from high to low and latency is the inverse (lower is better). To convert from score to latency use latency = 1/(score/1000).
Both the Atlas Max and Orbi 6 have latencies in the low 20 ms range, with the Linksys at 22.6 ms and the NETGEAR at 23.7; a negligible difference.

Routing latency score – 90th percentile
Wi-Fi Throughput
Although the Charts include average and maximum throughput in the ranking algorithm, along with range, all are pulled from the throughput vs. attenuation (aka RvR) benchmarks. So that’s our focus for comparing the basic performance of the Atlas Max’ radios. Keep in mind that all the Atlas Max’ radios are four-stream while the NETGEAR’s are only two-stream. Keep in mind channel bandwidth used for the following benchmarks are 20 MHz @ 2.4 GHz , 80 MHz @ 5 GHz and 160 MHz @ 6 GHz.
2.4 GHz downlink shows both products tracking pretty closely, albeit with the Linksys having a slight advantage in the low attenuations (higher signal). But near the end of the run with signals getting pretty low, the NETGEAR pulls ahead, still producing 15 Mbps of usable throughput at the maximum attenuation value tested.

2.4 GHz throughput vs. attenuation – downlink
2.4 GHz uplink shows the Linksys with a slight advantage in low attenuations, but falling behind as attenuation increases (signal level drops).

2.4 GHz throughput vs. attenuation – uplink
5 GHz downlink again shows the Linksys with a throughput advantage over the NETGEAR. But this time it maintains the advantage throughout the test run. The additional link gain provided by the Linksys’ extra two streams finally provides an advantage.

5 GHz throughput vs. attenuation – downlink
5 GHz uplink shows the four-stream Linksys again besting the two-stream NETGEAR for the entire test run.

5 GHz throughput vs. attenuation – uplink
Since routers and mesh systems are tracked in different charts, I had to manually pull 6 GHz comparison data together for plotting. 6 GHz downlink shows all four routers pretty evenly matched. Once again, however, the Atlas Max has the advantage with stronger signals, then falling off more rapidly as attenuation increases. The Hydra Pro 6E’s (MR7500) throughput actually holds up a bit better than the Atlas Max

6 GHz throughput vs. attenuation – downlink
6 GHz uplink clearly shows both Qualcomm-based Linksys routers with significantly higher (~ 400 Mbps) throughput for the first third of the test run. The Hydra Pro 6E once again maintains higher throughput longer than the Atlas Max 6E.

6 GHz throughput vs. attenuation – uplink
Multiband Throughput
The new Multiband benchmark is the first SNB benchmark that simultaneously loads all radios in a router/AP/mesh node and that also measures latency under load. It’s a good way to see whether (or how much) Ethernet port speed limits what you can get out of an AP. And since it’s run on each node in a mesh system, it’s also a good way to gauge backhaul bandwidth. Keep in mind, however, that you’d be hard-pressed to push an AP to the limits tested by this benchmark.
The test is run on each mesh node, with the mesh in multi-hop configuration, also known as daisy-chain. "Hop 1" connects back to the Root node, while "Hop 2" should connect only to "Hop 1" and then back to Root. It’s possible that the "Hop 2" node could also have a direct connection back to the Root node. But since the path loss (signal attenuation) from Hop 2 to Root would be about 2X the loss from Hop 2 to Hop 1, that would not be a good choice for routing the packet.
The first plot shows throughput for the 2.4 and 5 GHz radios at the root mesh node for the Linksys and NETGEAR systems. It’s clear that the Atlas Max has the advantage on both bands.

Multiband Throughput per radio – Root node
Moving to the Hop1 node brings backhaul performance into play. The Linksys still beats the NETGEAR on 2.4 GHz, but its throughput craters on the 5 GHz radio.When looking at these results, keep in mind that since both mesh node radios are simultaneously running traffic, the total of both bands’ throughput is being run through the backhaul. So while the NETGEAR Hop 1 node is providing 491 Mbps total throughput to its two associated STAs, while the Linksys is passing along only 331 Mbps.

Multiband Throughput per radio – Hop 1 node
Tables 2 and 3 show the throughput change for each band, referenced to Root throughput, for 2.4 and 5 GHz, respectively. I also included the Linksys’ Hop 2 data even though the NETGEAR system has only one hop. Even though the Linksys’ Hop 1 throughput is higher than the NETGEAR, the percentage throughput loss is almost 5X.
| Linksys Atlas Max 6E | NETGEAR Orbi 6 | |||
|---|---|---|---|---|
| Throughput | % change from Root | Throughput | % change from Root | |
| Root | 376 | – | 200 | – |
| Hop 1 | 232 | -38 | 185 | -8 |
| Hop 2 | 21 | -94 | N/A | N/A |
Table 2: Multiband throughput change, Root to Hop 1 node – 2.4 GHz
For 5 GHz, the Linksys’ throughput is around 3X lower than the NETGEAR’s and its Hop 1 loss is 30% higher. Although the Linksys’ Hop 1 to 2 loss is only (!) 78%, the Root to Hop 2 loss is just shy of 100%, reducing the almost gigabit bandwidth of the Root node into low double digits.
| Linksys Atlas Max 6E | NETGEAR Orbi 6 | |||
|---|---|---|---|---|
| Throughput | % change from Root | Throughput | % change from Root | |
| Root | 933 | – | 742 | – |
| Hop 1 | 99 | -89 | 306 | -59 |
| Hop 2 | 22 | -98 | N/A | N/A |
Table 3: Multiband throughput change, Root to Hop 1 node – 5 GHz
In all, these results tell me something is seriously wrong in the Atlas Max’s backhaul management.
Multiband Latency
For latency, CDF plots tell the story better than bar plots because they show latency and latency spread (jitter). Unfortunately, the SNB Chart system can’t produce them; I generated these using octoScope’s Expert Analysis tool.
The Root node 2.4 GHz latency CDF plot below shows the NETGEAR’s 90th percentile latency is about half the Linksys’ (107 ms vs. 229 ms). The Linksys’ long tail of low latencies, however, says its latency variation, i.e. jitter, is greater.

Multiband Latency CDF plot – 2.4 GHz comparison – root
The Root 5 GHz Latency CDF shows the NETGEAR again easily besting the Linksys for both latency (19 vs. 83 ms) and jitter.

Multiband Latency CDF plot – 5 GHz comparison – root
Moving along to the Hop 1 node shows latency predictably degrading since backhaul latency is now also in play. Note the scale has doubled. If I had expanded it to show the Atlas Max 6E’s entire range of values, it would have extended to 1700 ms. While both latencies have increased, the gap between the 2.4 GHz latencies has closed, with the NETGEAR 90th percentile value of 228 ms and the Linksys with 288 ms.

Multiband Latency CDF plot – 2.4 GHz comparison – Hop 1
Hop 1 5 GHz latency for the Orbi also increases at 151 ms vs. 19 ms for root. But the Linksys’ gets much worse 308 ms vs. 83 ms for root.

Multiband Latency CDF plot – 5 GHz comparison – Hop 1
Since the NETGEAR has no Hop 2, I’ll just show both its 2.4 and 5 GHz latency on one plot. Clearly, things are not good in latency-land by the time packets have gone through two hops.

Multiband Latency CDF plot – 5 GHz comparison – Hop 1
Multiband time plots of throughput, latency and loss tell the story very succintly. The composite plot below shows Root, Hop 1 and Hop 2 left to right. Note that the Hop 1 ping plots for both bands are essentially the same, that tells me that backhaul latency is dominant. It’s clear that things are not good in either throughput or latency-ville in Hop 2.

Multiband throughput, latency, loss vs. time, root, Hop 1, Hop2 – Linksys Atlas Max 6E
While I can show only Root and Hop 1 for the Orbi 6, the difference is striking. I apologize for the scale differences, but the Orbi’s latencies look significantly better than the Atlas Max’, even though both are showing low levels of ping loss. Hop 1 throughput is both higher and more stable, too.

Multiband throughput, latency, loss vs. time, root, Hop 1, Hop2 – NETGEAR Orbi 6
Mesh Capacity
The last benchmark associates one STA per mesh node, runs TCP/IP traffic to all STAs simultaneously and looks at total throughput and latency per node. The previous version of this test used unlimited bandwidth TCP/IP traffic on all STAs, but associated a 2.4 GHz STA to the root node and 5 GHz STAs to other nodes. This was an attempt to not totally kill the backhaul on systems with no dedicated backhaul radio.
This time, the test uses all 5 GHz STAs, but limits each STA’s throughput to 250 Mbps. Since a two-stream AX STA can produce around 900 Mbps of throughput with a strong signal, this test should not fully load a 5 GHz channel. The ideal throughput result for this test should be 500 Mbps for two nodes nad 750 Mbps for three nodes.
The Atlas Max was such a hot mess in this test that it’s better to start with the time plot. It’s clear that the Linksys didn’t achieve the 750 Mbps it should have; this was actually one of the better results. The throughput jump around 60 seconds in is due to both Hop1 and Hop 2 node STAs disassociating. Hop 1 comes back a short time later to share the channel; Hop 2 never recovers. I saw this behavior in run after run. Don’t even try to make sense of the Data Rate and MCS plots. But you can see the # of streams the STAs are using flap between 1 and 2 throughout the test run.
90th percentile latencies are not great for either root (320 ms) or the Hop 1 (768 ms) nodes. Best case both nodes’ latencies tend to run in the mid 100’s.

Mesh capacity time plots – Atlas Max 6E
Now check out the same plot for Orbi 6. Not much to say except this is how a two node mesh should perform on this test. Note the latency for both STAs mostly between 10 and 20 ms. Remember, the Hop 1 latency includes latency in the backhaul.

Mesh capacity time plots – NETGEAR Orbi 6
These pictures tell the story better than anything else I can write. So I’ll stop here.
Closing Thoughts
At $1200, the Linksys Atlas Max 6E is the most expensive mesh Wi-Fi system you can buy, but I wouldn’t if I were you. Given the potential 4804 Mbps of bandwidth when the four-stream 6 GHz radio is used for backhaul and half that when 5 GHz is used, I’d expect client bandwidth to spare (multiple hundreds of Mbps) on even the second mesh hop. The system delivers nowhere near that. And don’t even get me started on latency.
It’s too bad, because a single node is actually a decent Wi-Fi 6E router, and there aren’t many of those available. And for the same $500, the MX8501 SKU is a much better deal than the Hydra Pro 6E, since the Atlas Max 6E is a fully four-stream design. If you’re considering a Linksys 6E router, the Atlas Max 6E "1 pack" is the one to get.