Updated – This article describes how we test powerline products.
Environment
The Test Environment is an approximately 3300 square foot two-level home built on a hillside lot with 2×6 wood-frame exterior walls, 2×4 wood-frame sheetrock interior walls, and metal and metalized plastic ducting for the heating and air conditioning system.
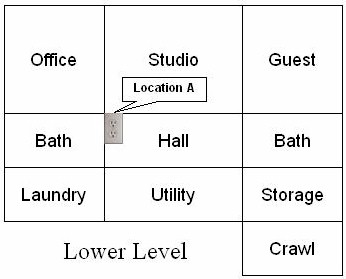
Figure 1 shows a simplified layout of the lower level and one of the three test locations. The Locations are in the same general areas as our wireless test locations, which is why they are named as they are.

Figure 1: Lower Level Test Locations
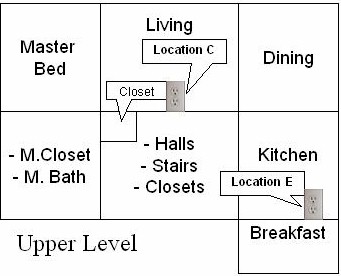
Figure 2 shows the upper level layout and the remaining two test locations.

Figure 2: Upper Level Test Locations
The test outlets were chosen so that none are behind AFCI breakers. The brand of AFCI breaker in the test home has been shown to severely reduce powerline throughput. No powerline noise sources are active during testing.
No effort was made to put the test outlets on the same or different branch circuits or phases of the split-phase 220VAC electric service. Current generation powerline adapters work with both conducted and induced signals. See our Powerline FAQ, Question 6.
Here are descriptions of the three test locations:
- Location A: The two adapters under test are plugged into the same wall outlet or two outlets in the same outlet strip.
- Location C: One adapter in Location A outlet. Second adapter in living room, one floor up and middle of home
- Location E: One adapter in Location A outlet. Outlet in kitchen, one floor up and opposite end of home
Adapter are plugged directly into wall outlets when tested. The only exception is the Location A test, where both adapters might be plugged into two outlets in the same outlet strip, if both will not fit into the same outlet.
If lower than expected throughput is seen with both adapters plugged into the same outlet (due to possible front-end overload), one adapter is moved to an outlet on the other side of the same wall, which is on a different branch circuit.
Test Description
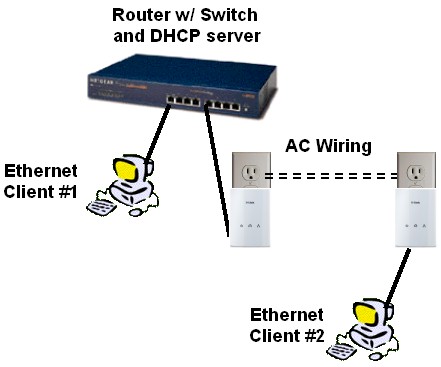
Ixia’s IxChariot network performance evaluation program is used with the test configuration shown in Figure 3 to run tests in each of the test locations.
Test clients are equipped with PCIe based Gigabit Ethernet adapters, Core 2 Duo or better CPUs and run Windows XP SP3 or Windows 7.

Figure 3: Powerline test setup
At each test location, the IxChariot Throughput.scr script is run for 1 minute in real-time mode using TCP/IP in both uplink (Client 2 to Client 1) and downlink (Client 1 to Client 2) directions. Client 2 runs the IxChariot console and Endpoint 1.
Updated 9/19/2012
Powerline technology can produce higher total bandwidth when more than one traffic session is present. So we also run a simultaneous up and downlink test and a test with four simultaneous throughput scripts running. These simultaneous tests are run only in Location A.
The only modification made to the IxChariot script is to change the file size from its default of 100,000 Bytes to 1,000,000 – 5,000,000 Bytes. File size is adjusted as needed to obtain enough resolution to see large throughput dropouts, but also to provide some plot smoothing for readability. Typically this is 3,000,000 Bytes for 200 Mbps and higher powerline products.
Tests are generally run once. But if a test run reveals unusually high throughput variation or low throughput, tests are repeated so that we can determine whether the bad run was an anomaly. If a test is repeated, the best of the runs is used.
