Introduction
![]()
In the last installment, I said that I would look at Windows Home Server as the first "Fast NAS" operating system. Microsoft provided copies of WHS and Vista Home Premium so that I could also check into the reports by readers in the Forums of higher NAS performance using Vista clients.
For reference, Table 1 summarizes the "Big NAS" testbed machine. Note that I have corrected the power supply information to reflect what is actually used.
| Components | |
|---|---|
| Case | Foxconn TLM776-CN300C-02 |
| CPU | Intel Core 2 Duo E7200 |
| Motherboard | ASUS P5E-VM DO |
| RAM | Corsair XMS2 (2 x1GB) DDR2 800 |
| Power Supply | ISO-400 |
| Ethernet | Onboard 10/100/1000 Intel 82566DM |
| Hard Drives | Seagate Barracuda ST31000340AS 1TB 7200 RPM 32MB Cache SATA 3.0Gb/s |
| CPU Cooler | ASUS P5A2-8SB4W 80mm Sleeve CPU Cooler |
Table 1: Fast NAS Test Bed Component summary
Windows Home Server does not use RAID for its very flexible drive expansion capabilities. Instead, it uses a Microsoft technology dubbed Windows Home Server Drive Extender (DE). You should read the Microsoft white paper for the whole explanation of DE. But I’ll pull some of the key points from that document for the brief explanation of DE that follows.
In a single hard-drive system, Windows Home Server is configured with a 20-gigabyte system partition for the Windows Home Server operating system, and the remainder of the primary hard drive is allocated to the primary data partition. Each subsequent (or secondary) hard drive is logically added to the data partition. It appears to the user as one large hard drive; however, these drives are considered to be part of the secondary data partition. In reality, your home server consists of multiple hard drives of varying sizes.
The primary data partition is used to store a unique entry for each file. If a home server has more than one hard drive, these files become “tombstones.” Tombstones are NTFS file system reparse points that Windows Home Server Drive Extender understands. They are tiny files that redirect to one or two “shadow” files on the hard drives that make up the secondary data partition. The shadow files are where your data is really stored. If folder duplication is enabled for a Shared Folder, there will be two shadow files. If duplication is Off, there will be one shadow file.
Windows Home Server Drive Extender creates the illusion of having a very large primary data partition by migrating files to one or more secondary data partitions. To complete the illusion, Windows Home Server Drive Extender leaves a “tombstone” file on the primary data partition, so that the user still sees the file in its original location.
For example, even though Sample.jpg is not really taking up space on the primary data partition, it shows up if you type “dir” at a command prompt or open Windows Explorer from the primary data partition. These tombstones effectively act as symbolic links to the shadow files.
Basically, this means that WHS doesn’t use alternate reads or writes to multiple drives as RAID can, and so will ultimately be limited by single-drive transfer performance. This means that is will probably hit the ~67 MB/s single-drive "wall" that we saw in Part 2. But let’s see how it does anyway.
Note: Some users in the WHS Forums report using RAID arrays as WHS storage. But Microsoft doesn’t support RAID in WHS and recommends that it not be used.)
Testing, Testing
I started out by using four of the Seagate drives for my first test runs anyway, mainly because I already had them configured into the system. But, as noted above, we’re really looking only at single-drive performance.
Figure 1 shows write data from the first set of iozone runs. Both the NAS and iozone machine used their internal Intel PCIe-based gigabit Ethernet interfaces unless otherwise noted. The plot includes reference lines from actual test data from the PCI and PCIe-based gigabit Ethernet performance testing that I did in the Gigabit Ethernet NeedTo Know – 2008 for reference. I limited the Y axis to better see performance differences during the cached to non-cached performance transition.

![]()
Figure 1: WHS and QNAP TS-509 Pro Write Performance Comparison
Tests plotted are:
- 2 GB – NAS configured as in Table 1, with 2 GB of memory
- 1 GB – Same as #1, but with NAS memory reduced to 1 GB
- TS-509Pro, 1x1TB – QNAP TS-509 Pro with a single 1 TB drive
- TS-509Pro, 1x1TB, PCI – QNAP TS-509 Pro with a single 1 TB drive and iozone machine using Intel PRO/1000 MT PCI-based Ethernet adapter
I thought it would be helpful to first compare the WHS NAS against the QNAP TS-509 Pro, which is the highest performance NAS tested to date (it has 1 GB of RAM). You can see that using the PCI-based NIC in the iozone machine definitely held back write performance.
You can also see that the WHS NAS, which also has a significantly beefier Core 2 Duo E7200 (vs. the QNAP’s Celeron M 420 1.6GHz), has faster write performance than the TS-509 Pro until we get out to the 2 GB file size. The "1GB" plot shows that the performance difference isn’t just due to 2 GB of RAM on the WHS NAS vs. 1 GB in the TS-509 Pro.
Figure 2 shows the read results for the same group of tests. What you see is very similar to the QNAP TS-509 Pro tests in Part 2. Except for the TS-509Pro, 1x1TB, PCI line, everything tops out at around 67 MB/s. Not at all what I hoped for!

![]()
Figure 2: WHS and QNAP TS-509 Pro Read Performance Comparison
But since the iozone test machine had 1 GB of RAM, these tests really show only one point that exceeds both WHS NAS and iozone machine caches. So, for all the subsequent tests, I reduced the iozone machine’s RAM size to 512 MB.
Enter, the VelociRaptor
Since in Part 2, I had reached the "It’s the Drive, Stupid!" conclusion, I contacted Western Digital who kindly provided a few of their WD3000HLFS VelociRaptor drives, which are, according to WD, "The Fastest SATA Drive in the Known Universe".
The VelociRaptor is the second generation of WD’s "Raptor" line, which are all based on 10,000 RPM 2.5" drive mechanisms. For the 3.5" models, the 2.5" drive is ensconced in a heatsink / frame dubbed the "IcePack" (Figure 3).
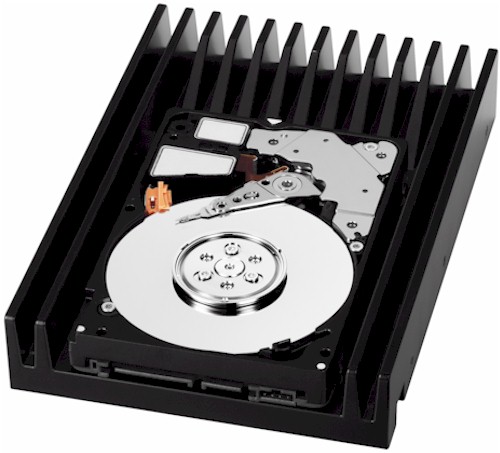
Figure 3: WD VelociRaptor
A quick check with Simpli Software’s HD Tach confirmed a > 100 MB/s average read transfer rate (Figure 4).

![]()
Figure 4: VelociRaptor HD Tach results
Figure 5 adds two test runs with the VelociRaptors to the tests shown in Figure 2. (I removed the TS-509 Pro, PCI run to reduce chart clutter.)
So we now have:
- 2 GB – NAS configured as in Table 1, with 2 GB of memory
- 1 GB – Same as #1, but with NAS memory reduced to 1 GB
- TS-509Pro, 1x1TB – QNAP TS-509 Pro with a single 1 TB drive
- 1GB, VRaptor – NAS memory @ 1 GB, iozone memory @ 512 MB
- 1GB, VRaptor, 4kjum – same as #4, but w/ 4k jumbo LAN connection
The interesting thing in this graph is that the VelociRaptor doesn’t improve write performance until we hit the 2 GB non-cached test. But there, it keeps performance up near 80 MB/s, while the Seagate drive drops off to around 51 MB/s. Note also that using 4k jumbo frames actually reduced performance.

![]()
Figure 5: Write Performance Comparison w/ VelociRaptor
Read performance (Figure 6) shows that the VelociRaptor has some value-add. Throughput drops only to 51 MB/s for the 2 GB file size, while the Barracuda sinks to 15 MB/s when caching stops. But there is still no performance improvement for most of the file sizes—the “Wall” remained intact.

![]()
Figure 6: Read Performance Comparison w/ VelociRaptor
Trying out Vista
If you have been following the discussions in the Forums, you know that multiple people have reported significantly improved file copy performance when using Vista, especially SP1. The Inside Vista SP1 File Copy Improvements blog post by Mark Russinovich explains the background of the improvements. The post also reveals that, contrary to other reports, the improvements are not primarily due to Vista’s use of SMB2, although SMB2 is in the mix.
So I hitched up my pants, Ghosted the iozone machine and installed Vista Home Premium. Of course, Vista didn’t include drivers for the Intel 82566DM gigabit LAN interface, so I had to track down the all-OS install version of the Intel PRO LAN drivers (LAN_ALLOS_11.2_PV_TL3_132319_FULL.EXE), copy them to a flash drive and transfer them to the iozone machine. I also let Vista do its Windows Update thing, which took another hour or so.
I was in a hurry to get started, however, and didn’t notice that the updates didn’t include SP1, with its reported file copy improvements. So I inadvertently got a look at performance both without and with the improvements—and it’s fortunate that I did!
Figure 7 includes the Vista results, which include a few other variations. I dropped the 2GB and TS-509 Pro results, to keep chart clutter down. I also narrowed the Y axis, to better see the plot differences.
Plotted are:
- 1 GB – NAS memory @ 1 GB, iozone memory @ 1 GB
- 1GB, VRaptor – NAS memory @ 1 GB, iozone memory @ 512 MB
- 1GB, VRaptor, No dup – same as #2, but with WHS file duplication disabled
- 1GB, VRaptor, No dup, iozone Vista – same as #3, but with Vista on iozone machine (still @ 512 MB)
- 1GB, VRaptor, No dup, iozone Vista, ct – same as #4, but using Intel PRO/1000 CT PCIe adapters on iozone and BigNAS machines.
- 1GB, VRaptor, No dup, iozone Vista SP1 – same as #4, but Vista SP1 on iozone machine.
Figure 7 shows the write runs plotted. Best performance is with the internal gigabit adapters on both the iozone and "BigNAS" WHS machine, file duplication disabled and Vista on the iozone machine.
The reason that I tried the add-in PCIe adapters was to see if the internal adapters were somehow limiting performance. Instead, I found that the on-board adapters produced better throughput! But both Vista runs produced significantly better write throughput—~100 MB/s, even after OS caches were exhausted!

![]()
Figure 7: Write Performance Comparison w/ VelociRaptor and Vista
But the real surprise was worse performance using Vista SP1! Cached throughput is better than with XP running on the iozone machine. But as soon as iozone machine cache is exceeded, performance falls below that of XP!
Figure 8 holds some good news, however. It appears that Vista running on the iozone machine breaks us through the "Wall" to a new 77 MB/s high. That configuration even manages to stay up near 60 MB/s for the 1 and 2 GB file sizes!

![]()
Figure 8: Read Performance Comparison w/ VelociRaptor and Vista
Everything else however, except for the "1 GB" using the Seagate drive, clusters together at the "Wall". The differences you see are not significant and probably within the accuracy of the test method.
Lessons Learned
This little exercise involved a lot of behind-the-scenes head-scratching and consultation with Don Capps (Mr. iozone) as I tried to make sense of the results. I kept thinking that something else (besides drive performance) was causing all the read results to crash up against the 67 MB/s "Wall"—especially when I saw the VelociRaptor results!
And actually, it appears that there were OS-related issues holding back read performance, because I was able to gain around 10 MB/s of speed by switching iozone from running on XP to Vista. But that gain wasn’t very stable, since moving to Vista SP1 knocked performance right back down again.
In the end, some of the main lessons learned are pretty much the same as from Part 2:
1) If you’re using only one drive in your NAS, its performance is going to ultimately determine your maximum read performance. And for today’s 7200 RPM SATA drives, that’s going to be around 70 MB/s.
2) OS caching is the main determinant of maximum write performance, until you exceed available memory. Then drive transfer rate will determine your performance.
But there were some new revelations, too:
3) Spending big bucks on a high performance drive for a NAS may not yield the improved performance seen in internal drive applications. There are many more factors involved in network file system and copy performance that can swamp out the advantages of a "hot" drive.
4) Using Vista on a client machine can significantly improve file transfer performance. But, then again, it might not. And SP1 isn’t guaranteed to provide an additional performance boost, either.
There have been some good discussions going on over in the Forums about the series so far. If you already haven’t, check out the threads for Part 1 and Part 2 and join in if you have something to contribute.
So I haven’t yet found the secret to building a NAS capable of 100 MB/s write and read performance. But I’m now even more convinced that one of the keys lies in effectively interleaving multiple drives to get past single-spindle speed limitations. Next time, we’ll see if we can reliably break through the single-drive performance wall by bringing RAID into play.