Updated 10/17/2012 – Added new backup device info. Updated some screenshots and information in Using Charts section. Removed Discontinued Benchmarks info.
What’s New
• For Network Storage devices tested between 27 August 2010 and 28 May 2009, please see this article (V3).
• For Network Storage devices tested between 27 May 2009 and 30 December 2008, please see this article (V2).
• For Network Storage devices tested before 29 December 2008, please see this article (V1).
NAS performance continues its march upward. Unsatisfied with shrinking margins on lower-end consumer-grade products, companies like QNAP, Synology, NETGEAR and Thecus have pumped out 5, 6 and more bay products aimed at displacing servers from Dell, HP and others in some applications.![]()
So our Intel Core 2 Duo E7200 based NAS testbed has been coming under pressure as these high-end NASes have been producing throughput closer and closer to its 125 MB/s limit. So it’s time retire it and bring on the SmallNetBuilder V3 NAS Testbed.
We’re also taking this opportunity to change and streamline our test benchmarks. We are retiring our long standing mainstay, iozone and bringing in a hand-picked group of tests from Intel’s NAS Performance Toolkit.
The main reason for the change is that while iozone’s ability to profile NAS throughput across many filesizes was interesting, it was only one view of NAS performance and took quite some time to run. With NASPT, we can run many different types of more meaningful NAS operation scenarios in the same or less time.
Along the same line of streamlining our testing, we’re no longer going to run benchmarks with 4K jumbo frames. We found little performance difference with 4k jumbo frames used on the previous testbed and found the same thing while shaking down the V3 testbed. Today’s fast CPUs, buses and Ethernet interfaces essentially provide higher networking performance without jumbo frames. So we’ll put the saved time to good use on other projects.
Testbed Configuration
We wanted this one to last awhile, so have equipped it with an Intel Core i3-540 Clarkdale 3.06GHz CPU and dual Intel CT Gigabit NICs that can be teamed to test NASes with dual teamable Gigabit ports. The testbed also has built-in eSATA and USB 3.0 ports, in case we decide to more frequently test direct-attached storage.
Finally, there are plenty of PCIe slots including two PCIe 2.0 x16, one PCIe 2.0 x1 and two PCIe 2.0 x1. So when we need to occasionally accommodate a 10Gbps fiber interface card, we’ll be able to.
On the software side, we’ve moved from Vista SP1 to Windows 7 Home Premium.
The V3 NAS Testbed machine summarized in Table 1 is capable of testing NASes with file transfer performance well beyond 125 MB/s when its aggregated Gigabit NICs are used.
| Components | |
|---|---|
| CPU | Intel Core i3-540 Clarkdale @ 3.06GHz |
| Motherboard | ASUS P7H57D-V EVO |
| RAM | 2 GB G.SKILL Ripjaws Series DDR3 1600 SDRAM (F3-12800CL9D-4GBRL) [one DIMM of set used] |
| Hard Drives | Samsung Spinpoint F3 1TB 7200 RPM 32MB Cache SATA 3.0Gb/s (HD103SJ) Two drives configured in RAID 0 array using onboard Intel RAID for file transfer testing HITACHI Deskstar 7K160 80GB (HDS721680PLA380) for Win7 OS |
| Ethernet | Intel Gigabit CT Desktop adapter (x2) |
| OS | Windows 7 Home Premium |
Table 1: NAS Testbed V3 configuration
Figures 1 and 2 show HD Tune write and read benchmark results on the RAID 0 array that will be used for File Transfer testing.
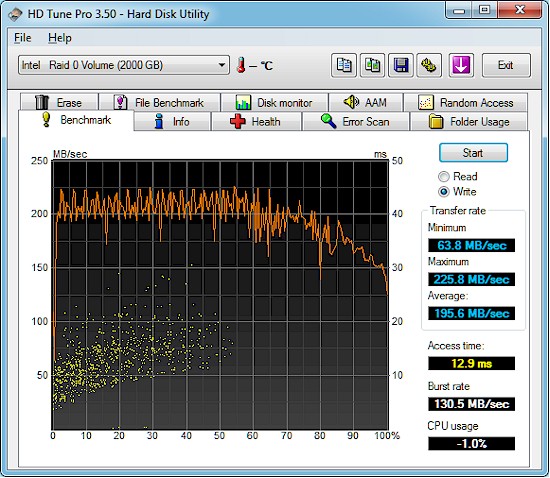
Figure 1: HD Tune write benchmark – Testbed R0 array
The array is made up of two Samsung HD103SJ Spinpoint F3 1 TB drives. I chose these drives due to their high performance, which is confirmed by the HD Tune plots.
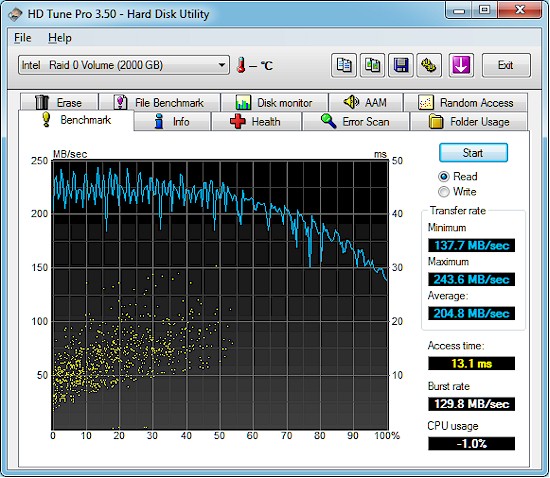
Figure 2: HD Tune read benchmark – Testbed R0 array
The file transfer test will use only a small portion of a 500 GB partition on the RAID 0 array, so it should be capable of 200+ MB/s write and read rates when used with an aggregated Gigabit link.
Note that a separate 80 GB SATA drive is used for the Windows 7 OS. This drive is not critical because it is not used for the File Copy test and Intel’s NASPT performance is not dependent on host machine hard drive performance.
The Benchmarks
All benchmark tests are run with the NAS under test connected to the V3 Testbed via a NETGEAR GS108T 10/100/1000 switch. A single Gigabit link will be used for tests unless otherwise noted.
Each benchmark test is run three times and the average of the three runs is used. Tests are mixed to eliminate "warm cache" effects, i.e. each test is not run three times in a row.
For products supporting RAID 5 or higher, RAID 1 tests are not run.
For multi-drive NASes, the benchmarks without a RAID designation, (Write File Copy, for example), are run in RAID 0.
About the Intel NAS Performance Toolkit (NASPT)
The NASPT is a file system exerciser and analysis tool designed to emulate the behavior of an actual application. NASPT uses a set of real world workload traces gathered from typical digital home applications.
NASPT reproduces the file system traffic recorded in these traces onto whatever storage solution the user provides and records the system response.
You can obtain more information about NASPT and download it from here.
The benchmark tests include:
- Windows File Copy: This is the only test common to the previous NAS test suite, but is run using Windows 7 instead of Vista SP1.
The tests are done using the robocopy command built into Win 7. The benchmarks consist of Write and Read transfers of a single test folder containing a single non-compressed ripped DVD. The 4.35 GB (4,680,843,264 bytes) folder contains 38 files of various sizes ranging from 1 GB to 10 KB. Transfers are executed to and from the dedicated RAID 0 volume on the NAS Testbed, which is capable of 200+ MB/s transfer speeds. - Intel NASPT File Copy To NAS: A single 1.15 GB windows backup file is written to the NAS.
- Intel NASPT File Copy From NAS: A single 1.15 GB windows backup file is read from the NAS.
- Intel NASPT Directory Copy To NAS: 236 MB consisting of 2,833 files in 44 folders is written to the NAS.
- Intel NASPT Directory Copy From NAS: 236 MB consisting of 2,833 files in 44 folders is read from the NAS.
- Intel NASPT Content Creation:
Scripted routine simulating a user creating a web advertisement from various content sources including video and 3D modeling software. 95% writes with mix of 1k, 4k & little reads. Wide range of writes up to 64kB, mostly sequential. - Intel NASPT Office Productivity:
Common productivity applications: e-mail, spreadsheet, etc. running scripted routines.
Balance of reads & writes, mostly 1k & 4k reads with a large number of smaller reads.
Mostly 1kB writes, mostly sequential accesses. - Intel NASPT HD Playback and Record: Simultaneous "playback" (read from NAS) and "record" (write to NAS) of approximately 500 MB 720p HD files. Both read and write are sequential.
- Intel NASPT 4x HD Playback: Simultanous "playback" (read from NAS) of four approximately 310 MB 720p HD files. Read is sequential.
Attached Backup
We test backup performance to an attached drive using built-in NAS backup features. The test used an Iomega UltraMax Pro Desktop Hard Drive configured in RAID 0 as the backup device up until September 2012. The test now uses a Startech USB 3.0 eSATA to SATA Hard Drive Docking Station (SATDOCKU3SEF) containing a WD Velociraptor WD3000HLFS 300 GB drive as the backup target.
The drive is attached via USB 2.0 and, if supported, eSATA and USB 3.0. Tests are performed with the drive formatted in FAT, EXT3 and NTFS, depending on the formats supported by the NAS under test.
The test copies the same 4.35 GB ripped DVD test folder used in the Windows File Copy tests from the NAS to the attached drive. Throughput is calculated using NAS-provided timestamps for the filecopy start and end.
Network Backup
We have added a network backup test for NASes that support this function, which is generally implemented by rsync. We use the same 4.35 GB ripped DVD test folder used in the Windows File Copy tests, which is first copied to the NAS under test.
The network backup target is a folder on the RAID 0 volume on the NAS test bed. Since Windows does not have a built-in rsync function, we run the DeltaCopy server to handle rsync.
A network backup job, with no encryption or compression and a full copy of the folder is then executed. Throughput is calculated using NAS-provided timestamps for the filecopy start and end.
iSCSI Target
To test iSCSI performance, a 10 GB iSCSI Target is configured on the NAS under test, using RAID 1 for dual-drive NASes or RAID 5 for multi-drive NASes that support it. An iSCSI initiator using an unencrypted connection is then configured on the NAS Testbed machine and connected via Gigabit Ethernet without jumbo frames to the NAS under test. Our standard Windows File Copy test is then run for read and write to the iSCSI target.
Using the Charts
Results are imported into the NAS Chart Database. The default view shows the Windows File copy benchmark, which is common to the current and previous test suites. The color of the bar indicates the version of test process used.
Figure 3 shows a cropped view of the NAS Chart in its default view. Other benchmarks are accessed using the Select benchmark dropdown.

Figure 3: NAS Chart default Windows File Copy view
Filters can be used to narrow the products shown. Filters are "sticky" and remain applied when you change benchmarks. So you may need to clear them if you get odd results.
Discontinued products are moved to the Archive and hidden by default. Clicking on the Archived Products [Switch to show] link will display them. This control is "sticky" and will remain applied when you change benchmarks.
The Features button displays detailed product information including noise level, power consumption, processor, memory and more. Data for up to four products can be shown simultaneously in table format
The Benchmark Summary button produces a summary of all benchmark results for a single product selected via checkbox.
The Price vs. Performance button generates a plot of product price vs. the selected performance benchmark (Figure 4). Note that it does not take into account NAS capacity so does not represent price / MB or GB. Mousing over a product icon will display the product name, model number, performance value and price.

Figure 4: Price vs. Performance – File Copy write
Questions and comments about the NAS Charts can be sent to [email protected].