Introduction
![]() NOTE:This article describes the wireless test procedure for products tested after July 25, 2014.
NOTE:This article describes the wireless test procedure for products tested after July 25, 2014.
For wireless products tested between April 15, 2013 and July 24, 2014, see this article.
We described the technology used in our new wireless test process in this article. Now it’s time to get into the exact details of how we use the new testbed.
Environment
Our V8 process is similar to the V7 process in that it uses octoScope anechoic chambers to provide a repeatable RF controlled test environment. The V2 testbed used by the V8 process has a turntable, which plays a key role in the new process.
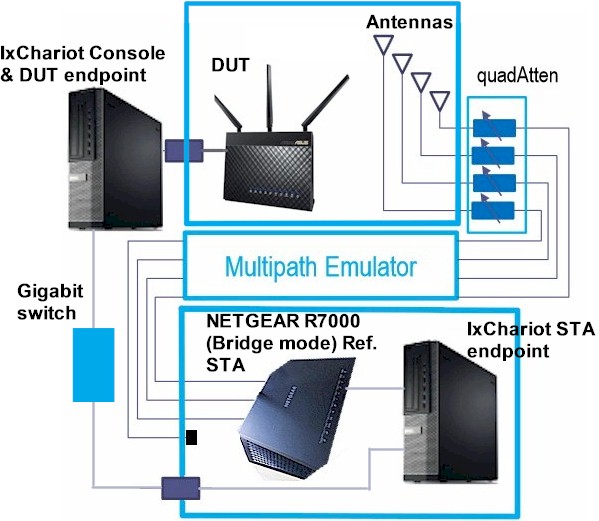
New SmallNetBuilder Wireless Testbed
The V8 process has been designed to address some weaknesses of the V7 process. Specifically:
- Small separation of DUT and chamber antennas
- Bias toward products with vertically polarized antennas
- The need to eyeball a "best" out of four test runs
- Inability to fully test AC1900 class products in 2.4 GHz
The V8 process uses the same attenuation settings for "Location" values that are used in some benchmarks for backward-compatibility with products tested with old open-air methods.
Key values for 2.4 GHz are shown in the plot below. Throughput at 0 dB attenuation is used for Maximum Wireless Throughput Ranking and throughput at 60 dB attenuation is used for Wireless Range Ranking in the Router and Wireless product Rankers.
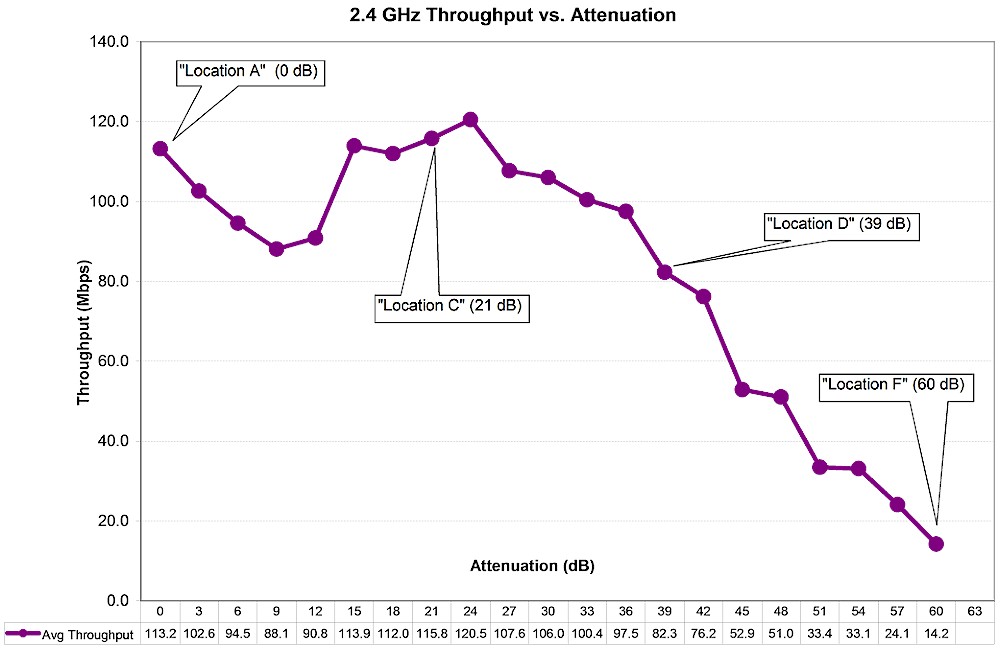
octoBox MPE Test Location Attenuations – 2.4 GHz
Key 5 GHz values are shown in the plot below. Throughput at 0 dB attenuation is again used for Maximum Wireless Throughput Ranking and throughput at 39 dB attenuation is used for Wireless Range Ranking in the Router and Wireless product Rankers. Less attenuation is used for range ranking in 5 GHz vs. 2.4 GHz due to higher path loss at those frequencies.
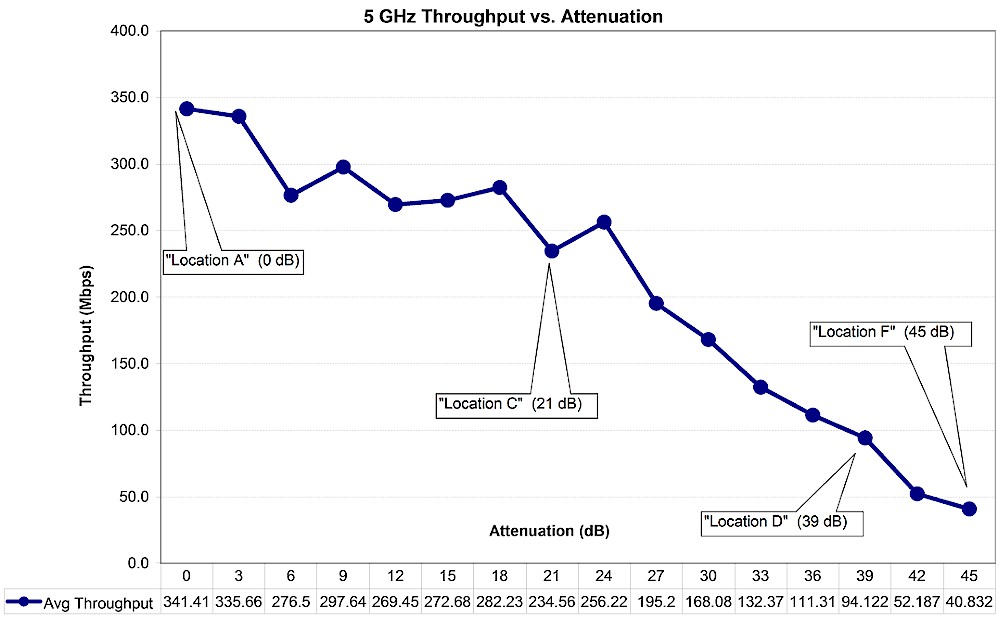
octoBox MPE Test Location Attenuations – 5 GHz
Test Setup
All wireless router performance testing is done on the LAN side of a router under test so that the product’s routing performance does not affect wireless performance results, i.e. the Ethernet client is connected to a router LAN port. Access points are tested using their Ethernet port.
The wireless router / AP under test (DUT) is centered on the upper test chamber turntable in both X and Y axes. If the DUT has external antennas, they are centered on the turntable. If the antennas are internal, the router body is centered. Distance from center of turntable to chamber antennas is 18 inches (45.72 cm).
Initial orientation (0°) is with the DUT front facing the chamber antennas. The photo below shows the 0° starting position for a NETGEAR R8000 Nighthawk X6 router, which has six external antennas arrayed along the sides of the product.
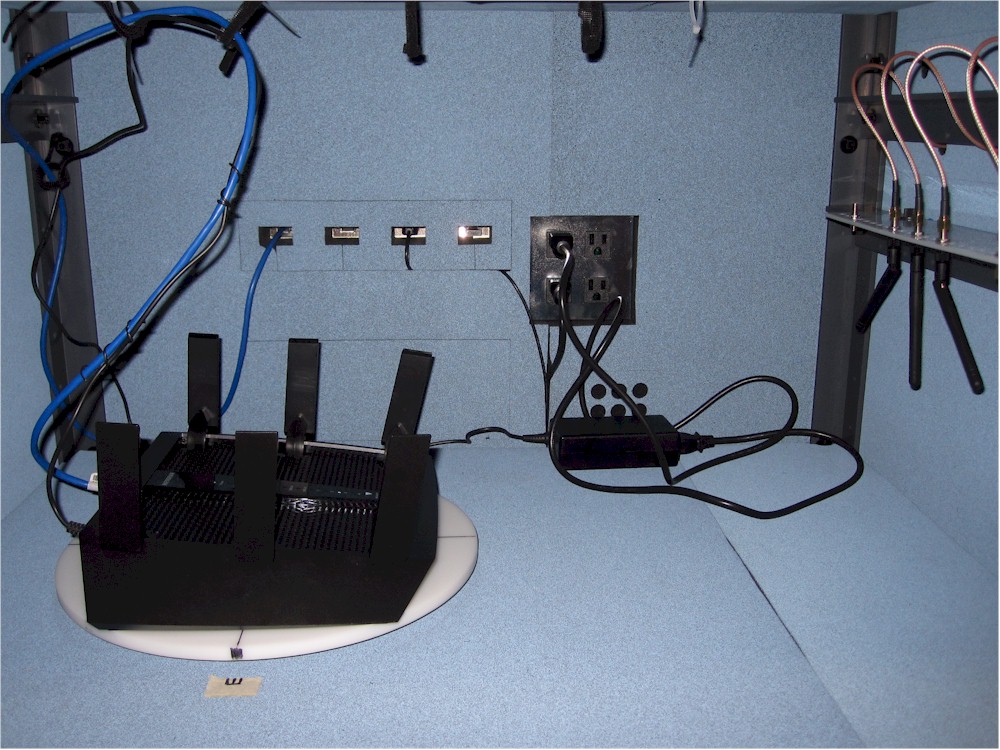
NETGEAR R8000 in Upper Test Chamber – "0 degree" Position
And here is an ASUS RT-AC68U in its starting test position. (The white object is an LED worklight removed during testing.) Power and Ethernet cables are routed to the DUT from above, to not interfere with DUT rotation.
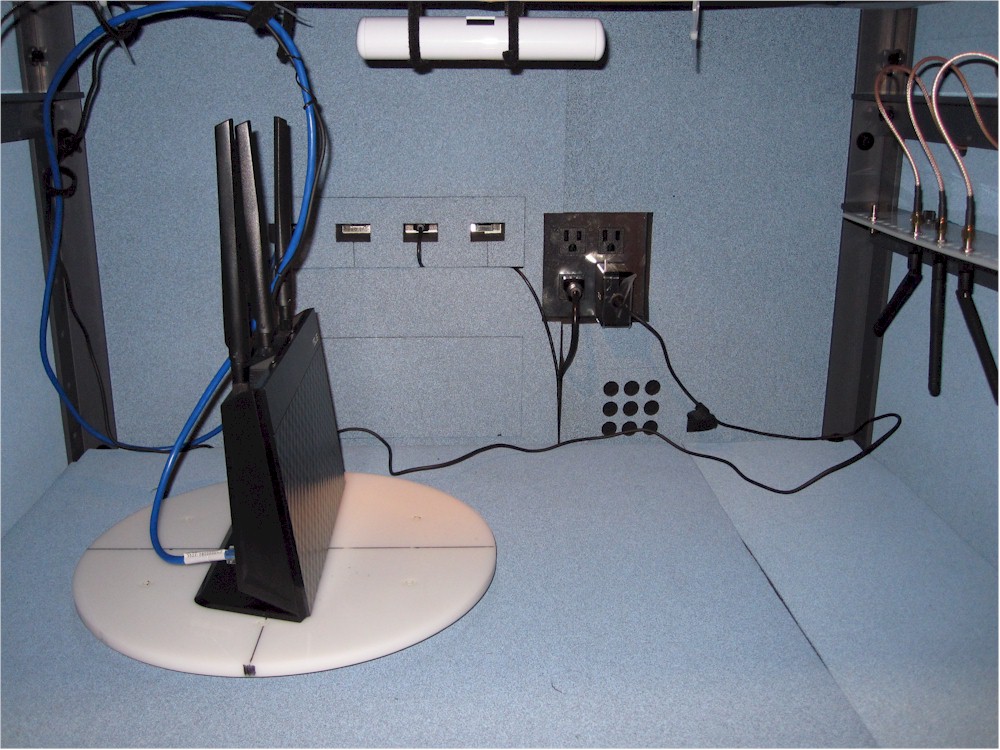
ASUS RT-AC68U in Upper Test Chamber – "0 degree" Position
The router or AP under test is set as follows:
- Reset to factory defaults
- WPA2/AES security enabled
- 2.4 GHz band: 20 MHz bandwidth mode, Channel 6
- 5 GHz band: 40 MHz bandwidth mode for N devices, 80 MHz bandwidth mode for 802.11ac devices, Channel 153
We continue to use 20 MHz bandwidth mode for 2.4 GHz testing. Most environments have too many interfering networks for reliable 40 MHz operation.
Test Process
Note: "Downlink" means data flows from router to client device. "Uplink" means data flows from client device to router.
The general test process is as follows:
- Check / update latest firmware
- Reset router to defaults
- Change router settings:
- LAN IP: 192.168.1.1
- 2.4 GHz: Ch 6, Mode: 20MHz, WPA key: 11111111
- 5 GHz: Ch 153, Mode: Auto or 80 MHz, WPA key: 11111111
- Associate client. Check connection link rate.
- Run IxChariot manual test to check throughput
- Run test script
- Power cycle DUT and repeat steps 4-6
Two test runs are made in each band for dual-band devices.
Testing is controlled by a Tcl script modified from a standard script supplied by octoScope. The script executes the following test plan:
- Move the turntable to starting position. This places the DUT at the "0 degree" starting position previously described.
- Program the attenuators to 0 dB
- Move the turntable to -180° (counter-clockwise)
- Start 90 second IxChariot test (throughput.scr with 5,000,000 Byte test file size) simultaneous up and downlink (0 dB only)
- Wait 30 seconds, then start turntable rotation to +180° at 1 RPM.
- Wait for test to finish
- Discard first 30 seconds of IxChariot data, calculate average of remaining data and save to CSV file. Save entire IxChariot.tst file.
- Repeat Steps 3 to 7 for downlink only (DUT to STA)
- Repeat Steps 3 to 7 for uplink only (STA to DUT)
- Increase attenuators by 3dB.
- Repeat Steps 3 to 9 until attenuation reaches 45 dB for 5 GHz test; 63 dB for 2.4 GHz test.
We continue to use the throughput.scr IxChariot script instead of the High_Performance_Throughput.scr script used by many product vendors.
We found in testing that using the throughput script and adjusting the file size upward actually produced slightly higher throughput than the high performance script.
The CSV files from the two test runs are merged into a single Excel file and the average of the two runs calculated. The average of the two runs is the value entered into the Charts database.
Test Notes
Moving the DUT through an entire 360° while the IxChariot test is running removes any orientation bias from the test and eliminates the need to determine the "best" run out of multiple fixed-position tests. Because throughput typically varies during the test run, the averaged result tends to be lower. Rotation at lower signal levels, particularly in 5 GHz, frequently causes the connection to be dropped sooner than if the DUT were stationary. For this reason, V8 5 GHz test results will generally not extend beyond 39 dB.
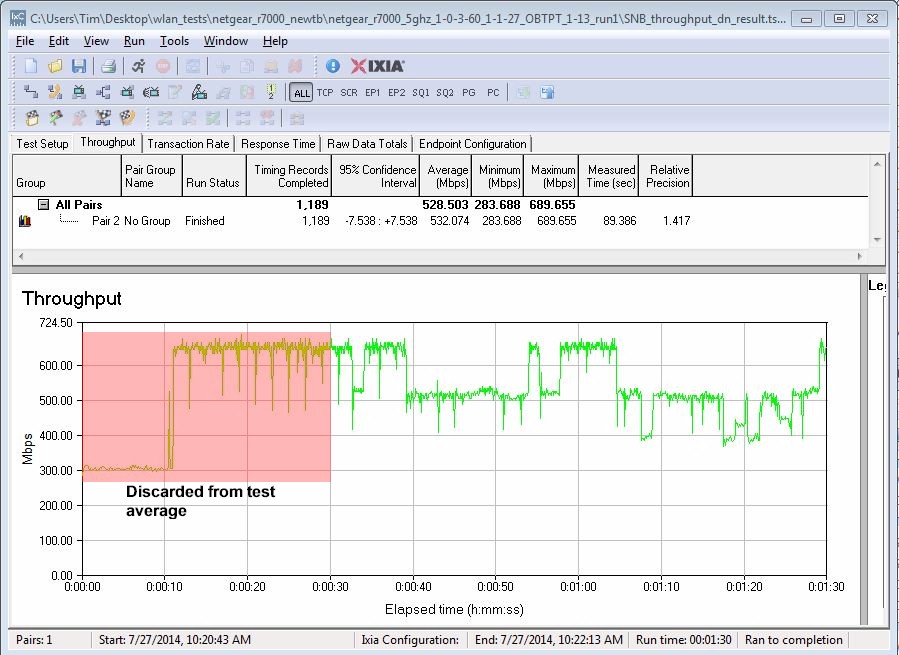
The IxChariot plot below shows a typical test run. The first 30 seconds of the run include a throughput step-up that is caused by an IxChariot artifact and does not reflect true device performance. The first 30 seconds also provides time for DUT rate adaptation algorithms to settle. For both reasons, the test script excludes the first 30 seconds of data in the average value saved in the Router Charts database.
IxChariot Test Data detail
Our testing focus has always been to provide results that provide the fairest relative comparison among products. This new process achieves that goal by removing multiple sources of test setup bias to achieve even fairer product-to-product comparison.
