Introduction
![]() NOTE:This article describes the wireless test procedure for products tested after April 15, 2013.
NOTE:This article describes the wireless test procedure for products tested after April 15, 2013.
For wireless products tested between July 24, 2011 and April 14, 2013, see this article.
Updated: 5/10/2013: Changed attenuation steps, test points and calculation method.
We described the technology used in our new wireless test process in this article. Now it’s time to get into the exact details of how we use the new testbed.
Environment
Our previous open-air process walked laptops with reference wireless adapters around an approximately 3300 square foot two-level home. Our new method uses the setup shown in the block diagram below and described in the article linked above.

New SmallNetBuilder Wireless Testbed
Because neither of the previous wireless clients was capable of testing 3×3 draft 802.11ac products, we have changed the reference wireless client (STA). The new client is a Dell Optiplex 790 Small Form Factor (SFF) computer (Core i5-2400 @ 3.1 GHz / 4 GB RAM) running Win 7 Pro with an ASUS PCE-66U AC1750 PCIe adapter. This adapter is capable of testing 802.11a/b/g/n/ac devices at link rates up to 1300 Mbps (3×3 products).
The new test bed controls signal levels with programmable attenuators instead of by walking laptops around to different home locations. For reference, the four open air method test locations are shown below.

Open Air Wireless Test Locations
Here are descriptions of the four test locations:
- Location A: AP and wireless client in same room, approximately 6 feet apart.
- Location C: Client in upper level, approximately 25 feet away (direct path) from AP. One wood floor, sheetrock ceiling, no walls between AP and Client.
- Location D: Client in upper level, approximately 35 feet away (direct path) from AP. One wood floor, one lower level sheetrock wall, sheetrock ceiling between AP and Client.
- Location F: Client on upper level, approximately 65 feet away (direct path) from AP. Four to five interior walls, one wood floor, one sheetrock ceiling between AP and Client.
As wireless signals travel between access point / wireless router (AP) and client (STA), they lose power. The amount of loss is known as path loss. In general, the higher the path loss, the lower the wireless throughput.
In the open air method, we changed path loss by moving from location to location. We chose the four test locations based on experimentation that showed they produced strong, medium, medium-low and low signal levels. In the new method, we change path loss via programmable attenuators.
While it is not possible for the new closed-chamber/octoBox MPE test method to produce results that exactly correlate to the old open air method, we want to be able to relate the results between the two methods. The challenge is to choose attenuator settings that most closely approximate the strong, medium, medium-low and low signal levels produced in the open-air tests.
We took signal level measurements at the open-air test locations using the new ASUS client adapter via three methods:
- RSSI from IxChariot uplink tests
- RSSI using MetaGeek’s inSSIDer
- Signal level using MetaGeek’s Wi-Spy DBx and Chanalyzer Pro
However, each of these methods produced different results that didn’t accurately reflect the path loss at lower signal levels.
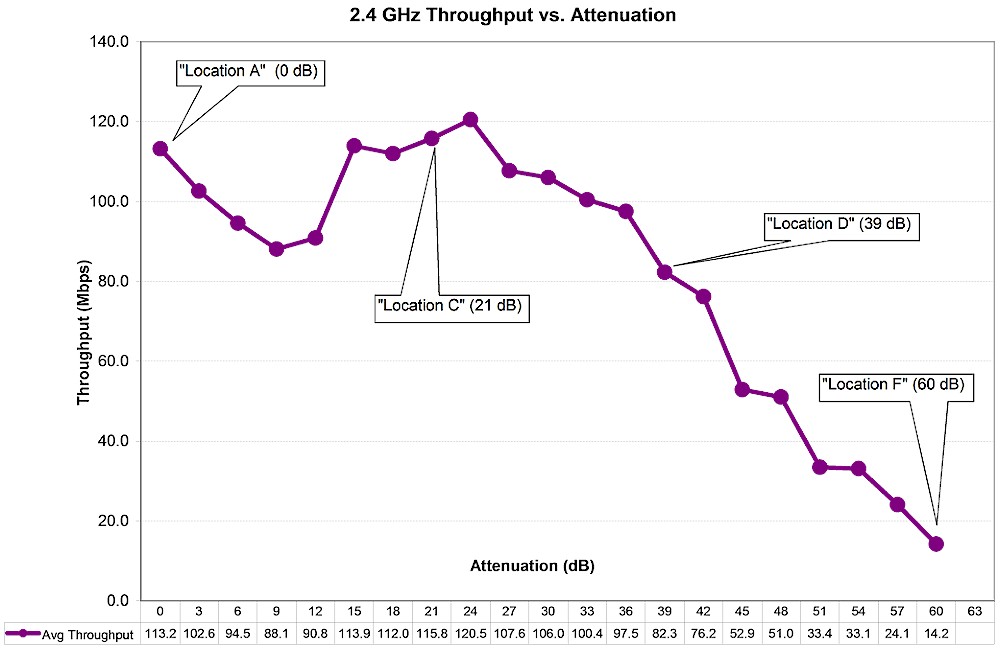
We also ran throughput vs. attenuation profiles using IxChariot for multiple products. There was similarity in the profiles and we ended up choosing the attenuation settings for the values that are entered into the charts as shown below for 2.4 GHz…

octoBox MPE Test Location Attenuations – 2.4 GHz
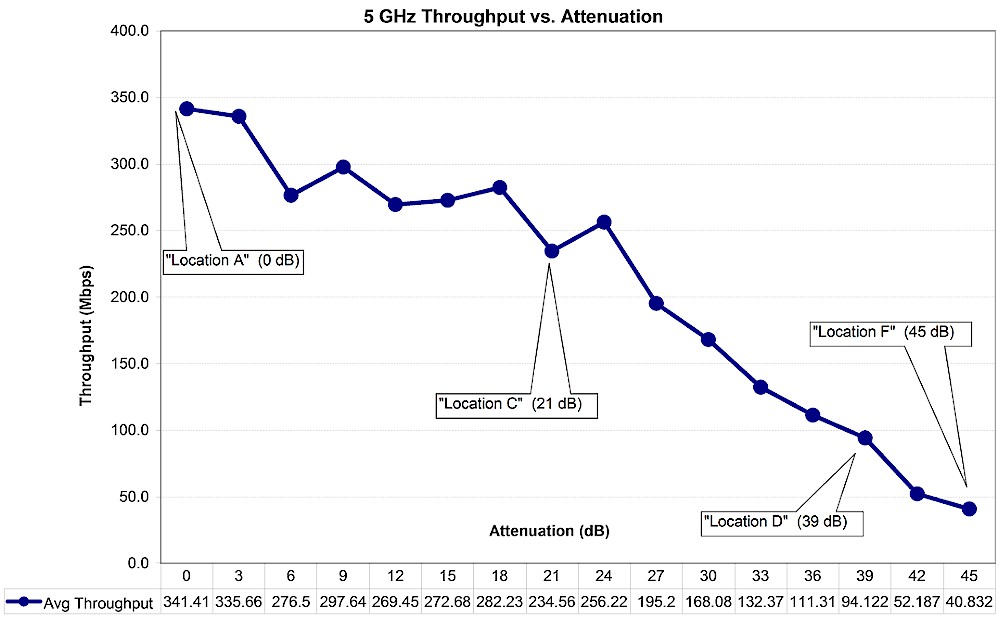
… and 5 GHz.

octoBox MPE Test Location Attenuations – 5 GHz
Note that we added a Location F for 5 GHz that we could not reach in open air testing. We will continue to use Location D for the Router Ranker 5 GHz range rank for now. But at some point we will change over to using Location F.
Test Description
On wireless routers, all testing is done on the LAN side of the router so that the product’s routing performance does not affect wireless performance results, i.e. the Ethernet client is connected to a router LAN port. Access points are tested using their Ethernet port.
The router or AP under test is set as follows:
- Router reset to factory defaults
- WPA2/AES security enabled
- 2.4 GHz band: 20 MHz bandwidth mode, Channel 6 (the previous test method version used Channel 1)
- 5 GHz band: 40 MHz bandwidth mode for N devices, 80 MHz bandwidth mode for 802.11ac devices, Channel 153 (the previous test method version used Channel 36)
The wireless router / AP under test (DUT) is placed into the upper test chamber so that there is an 8 inch distance between chamber antennas and the nearest edge/surface of the DUT. Initial orientation (0°) is with the DUT antennas oriented closest to the chamber antennas. The photo below shows the 0° starting position for a Linksys EA6500 router, which has internal antennas arranged along the front and sides of the product.

Linksys EA6500 in Upper Test Chamber – "0 degree" Position
And here is an ASUS RT-AC66U in the same starting test position.

ASUS RT-AC66U in Upper Test Chamber – "0 degree" Position
From the starting position, the DUT is rotated counter-clockwise 90, 180 and 270 degrees from the starting position. In each position, a suite of IxChariot tests are run using a Windows batch script. After testing, we decided to stay with the throughput.scr IxChariot script instead of the High_Performance_Throughput.scr script used by many product vendors.
We found in testing that using the throughput script and adjusting the file size upward actually produced slightly higher throughput than the high performance script.
File size is adjusted as needed to obtain enough resolution to see large throughput dropouts, but also to provide some plot smoothing for readability. We typically use a test file size of 5,000,000 Bytes and adjust downward if needed.
The test sequence is:
- Set the attenuators to 0 dB.
- Manually associate the test client to the DUT on the desired band using remote desktop access via VNC.
- Run the Windows batch script, which executes the following loop at multiple attenuations from 0 to 63 dB. Note that the maximum attenuator step is 5 dB to avoid premature STA disassociation from the DUT.
- Set the attenuators
- Wait for 2 seconds
- Run throughput.scr for 1 minute for simultaneous up and downlink (0 dB only)
- Run throughput.scr for 1 minute for uplink (STA to AP)
- Run throughput.scr for 1 minute for downlink (AP to STA)
- For dual-band devices, manually associate the test client to the other band and repeat Step 3.
- Rotate the DUT by 90 degrees counter-clockwise
- Repeat Steps 1 – 5 until tests runs have been completed for both bands in 0, 90, 180 and 270 degree positions for the DUT.
The batch script also converts each IxChariot test result to a CSV file. A Windows Powershell script then collates these CSV’s into an Excel workbook where the results of the 0, 90, 180 and 270 test runs are plotted for analysis. The test run with the highest overall performance is selected and throughput values that correspond to Locations A, C, D and F are entered into the Charts database.
