Introduction
Updated 6/25/2009
| At a Glance | |
|---|---|
| Product | MetaGeek Wi-Spy 2.4 Spectrum Analyzer |
| Summary | Suprisingly good, most inexpensive 2.4 GHz spectrum analyzer you can buy. – Consists of USB dongle and Win XP / 2000 application – Linux / MacOS software also available |
| Pros | • Real RF Spectrum analysis for $99 • Good detection range • Recording and playback |
| Cons | • Misleading amplitude information • Fixed amplitude range • Coarse frequency resolution |
When I first heard about a 2.4GHz spectrum analyzer for $99 bucks, I figured someone must have slipped a decimal point. But it turns out that MetaGeek’s Wi-Spy is real, does work, and can really be yours for a Benjamin, with change back to boot!
What it is
Wi-SPY consists of a small USB module that’s about the size and form factor of a small USB flash drive and a small software application. Figure 1 shows that the module is a JUNO-USB dongle, manufactured by Unigen, an OEM / ODM of memory, DC-DC power converter, wired and wireless communication, and flash products.

Figure 1: Unigen USB receiver
The Wi-Spy module is a Cypress WirelessUSB design, using a Cypress CYWUSB6934 LS 2.4GHz DSSS Radio SOC and CY7C63743 enCoRe USB Combination Low-speed USB & PS/2 Peripheral Controller. The key relevant tidbits that I picked up during a quick read of these datasheets is that the radio has a receive sensitivity of -90 dBm and has a top data transfer rate of 62.5 kbits/sec.
The software that comes with Wi-Spy runs on Win XP and 2000 only and requires the installation of Microsoft.Net Framework 1.1 or higher. The dongle is USB 1.1, so will also work with USB 2.0. If you’re not a Windows fan, you’ll be happy to know that Mike Kershaw, author of Kismet, has developed an open source version of the Wi-Spy software that runs on Linux, BSD, and Mac OS X. The blurb on MetaGeek’s website says “This application is under heavy development and is quickly progressing to become feature-equivalent to the Windows Wi-Spy software.” I worked only with the Windows version, but you can find out more about Mike’s version here.
The $3900 difference
I previously reviewed the AirMagnet Spectrum Analyzer, which is essentially a rebranded Cognio ISMS Mobile. (Cognio appears to be rebranding ISMS Mobile itself as “Spectrum Expert”.) Although the AirMagnet / Cognio product costs just shy of $4000, I thought it would be instructive to see what an extra $3900 buys. Table 1 summarizes the key product specs and features.
| Cognio’s Spectrum Expert |
Wi-Spy | |
|---|---|---|
| Frequency Coverage |
2.4 GHz (802.11b/g) |
2.4 GHz (802.11b/g) |
| Minimum Signal Level | -110 dBm | -90 dBm |
| Plotted Frequency Resolution | Unknown, but higher than Wi-Spy |
1 kHz |
| Minimum Resolution Bandwidth |
156 kHz | Unknown, but wider than Cognio |
| Views & Charts | Views – Real Time FFT – FFT Duty Cycle – Spectrogram – Power vs. Freq – Power vs. Time Charts |
Views – Analyzer (Spectrum) – Spectrograph
Charts |
| Plot Traces | – Max – Max Hold – Average |
– Data (same as Max) – Max Hold – Average |
| Movable Marker | Yes | Yes |
| Multiple Simultaneous Views | Yes | No |
| Record / Playback | Yes | Yes |
| Device List | Yes | No |
| Auto Interferer ID | Yes | No |
| Device Finder | Yes | No |
| Saved Data File Format | Proprietary | CSV |
Table 1: Cognio vs. Wi-Spy Specs and Features
Most of the features above are self-explanatory, but three need some explanation. Auto Interferer ID represents the ability to analyze the signals being captured, match them against signatures of interferences sources such as cordless phones, microwave ovens and other RF sources, and display an indication of devices found.
Device List is essentially that same analysis capability put to use, but for identifying and displaying valid Wi-Fi devices. Finally, Device Finder allows you to choose an identified valid device or interferer and physically track it down by displaying a signal strength vs. time chart and real-time signal strength meter to be monitored as you wander around in search of your quarry.
I should also note the way that MetaGeek has implemented Wi-Spy’s record and playback features. The record mode saves captured signal level data in 1 kHz increments from 2.400 GHz to 2.485 GHz to a CSV format file that can be opened with Excel or pretty much any spreadsheet. Opening the CSV file for playback lets you view the captured session in either Analyzer or Spectrograph mode, regardless of how you viewed it during capture, since both are alternate views of the same basic data. And MetaGeek uses the playback feature to teach users how to recognize signal patterns from cordless phones and microwaves by making files of captured sessions available for download.
That being said, the Cognio product beats Wi-Spy handily in frequency coverage, data views, signal range and plotted frequency resolution. And a look at Figures 2 and 3 shows that the Cognio product is more polished and reinforces its richer feature set.

Figure 2: Cognio Spectrum Expert default view
(click image to enlarge)

Figure 3: Wi-Spy default view
(click image to enlarge)
However, from the testing that I did, it appears that MetaGeek has made some intelligent trade-offs to come up with a product that’s 40 X cheaper than Cognio’s, but that still delivers a very useful combination of features and performance.
In Use
To test Wi-Spy’s performance, I set up a test WLAN consisting of a Linksys WRT54G and WPC54G client. I generated a nice, regular spectrum by running IxChariot‘s throughput script continuously sending data between the client and AP. I then loaded the Wi-Spy and Cognio hardware and software onto another notebook (which I’ll refer to as the measurement notebook) and ran them simultaneously while moving around to a few of my standard wireless test locations.
Figure 4 is a cropped screen shot taken while the measurement notebook was sitting in Location 1, which is the same room as the wireless LAN that I had set up.

Figure 4: Wi-Spy and Cognio – Location 1
(click image to enlarge)
Both applications were set to show two traces – peak max and real-time data – and the difference is immediately apparent. Wi-Spy’s real time plot (in yellow) appears to be coarser than Cognio’s (also in yellow), which I suspect is due to a wider resolution bandwidth in Wi-Spy. So you have to take Wi-Spy’s jagged real-time plot with a grain of salt, since the full-blast, continuous nature of the IxChariot script that I used should generate a spectrum closer to that shown by the Cognio device than Wi-Spy.
I also tried to resize both windows to match the graph scales as closely as I could. But it didn’t matter that much anyway, since the Wi-Spy Amplitude scale didn’t match the Cognio’s at all. Since I didn’t have a calibrated reference RF source to measure, I can’t pass too accurate a judgement on either product’s signal amplitude accuracy. But from previous experience, I have to say that the Cognio’s readings are closer to reality than Wi-Spy’s.
I next moved the measurement notebook to my Location 2, which is on the same floor and a few rooms away.

Figure 5: Wi-Spy and Cognio – Location 2
(click image to enlarge)
Figure 5 shows that the peak level measured by the Cognio drops from around -75 dBm to about -90 dBm, while Wi-Spy shows a drop from -35 dBm to around -53 dBm. So while the absolute reference levels differ greatly, the relative levels seem to match pretty well with both products showing about a 20 dB drop in signal. Note also that I had to use Wi-Spy’s maximum trace to make the previous determination; a technique that I found to be very useful.
In Use, Continued
Figure 6 shows the measurements made from my Location 3, which is a floor above, but closer (straight-line distance) to the test WLAN than Location 2. Once again the change in Cognio and Wi-Spy measurements track pretty well -65 to -75 dBm and -35 to -45 dBm respectively.

Figure 6: Wi-Spy and Cognio – Location 3
(click image to enlarge)
I also tried my more difficult Locations 4 and 5 and found that the Cognio could still capture a signal, while it was difficult to tell whether the Wi-Spy was really measuring anything or just random noise. It was these measurements made of low-level signals that convinced me that Wi-Spy users will probably find the Maximum Trace feature more useful than the Data (real-time) and Average traces.
I finally moved back to Location 3 and then ran a microwave oven that was located about 20 feet and a few walls away, with the results shown in Figure 7.

Figure 7: Wi-Spy and Cognio – Location 3 w/ Microwave
(click image to enlarge)
Due to the intermittent nature of the microwave interference (I ran it for only around 10 seconds), I had to rely on the maximum trace feature of both products, which produced remarkably similar results.
In Use – Spectrograph
In real-life, however, you probably won’t encounter nice steady wireless activity such as that produced by my IxChariot test script. That’s where Wi-Spy’s Spectrograph view will come in handy (Figure 8). This is essentially the same as the Cognio’s Swept Spectrogram feature and is a great way to see when and at what frequencies RF activity is taking place.
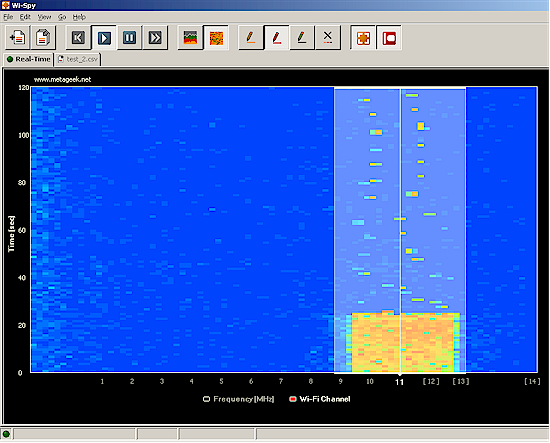
Figure 8 shows a Spectrograph of the test WLAN being idle, then being driven by the IxChariot script. The yellow area of the graph clearly indicates that something just lit up the airwaves! While you can’t view both the Analyzer and Spectrograph views simultaneously, captured data is buffered, so you can easily switch back and forth between windows. The Spectrograph window can be set to display data over periods from 2 minutes to 24 hours.
Closing Thoughts
Simply put, Wi-Spy is wireless LAN RF analysis for the rest of us, doing for wireless LAN RF analysis what NetStumbler and Kismet did for WLAN packet capture and display. Given the $2500 and up price points of every other available product, MetaGeek could have charged a lot more for Wi-Spy. But instead, they chose to be a breakthrough product, bringing real RF spectrum analysis within reach of everyone, not just Enterprise IT departments.
Sure, it doesn’t have all the features of the higher-priced products, and for $100 you don’t really expect it to. But MetaGeek seems to have made the right tradeoffs in Wi-Spy’s design, with the result being a product that delivers not only what’s needed, but some nice little extras, too.
Wi-Spy still has a few rough edges and I ran into a few error messages that were probably thrown by.Net, such as when I tried to bring up the Help menu after I had been running Wi-Spy for awhile. But if you’ve been lusting after the high-priced stuff for a cash-strapped IT department or just for hacking and exploration, then lust no more – just buy it!