Introduction
![]() NOTE:This article describes the wireless test procedure for products tested after May 15, 2016.
NOTE:This article describes the wireless test procedure for products tested after May 15, 2016.
For wireless products tested between July 25 2014 and May 15 2016, see this article.
The V9 process has been designed to address some weaknesses of the V8 process. Specifically:
- High 5 GHz path loss resulting in reduced test range
- Throughput vs. range results not experienced in most real-world use
- Lack of standard method for testing 4×4 maximum throughput
Throughput vs. Attenuation Test Configuration
We have chosen a 2×2 AC1200 class device as our new test standard for throughput vs. attenuation testing. This more accurately reflects the majority of devices in use today. Note that AC1200 does not support 256-QAM modulation in 2.4 GHz. Although 256-QAM support in 2.4 GHz has been widely adopted in new router designs, it is not part of the 802.11n standard and implementations can be trouble-prone. So the AC1200 standard STA will not test 256-QAM link rates.
The new standard test STA is an Intel Dual Band Wireless-AC 8260 card hosted in a Lenovo ThinkCentre Tiny M600 running Windows 7 Pro. We modified the Lenovo to disconnect the internal antenna and bring the card’s second antenna connection to an SMA connector mounted on the rear panel for fully-cabled connection.
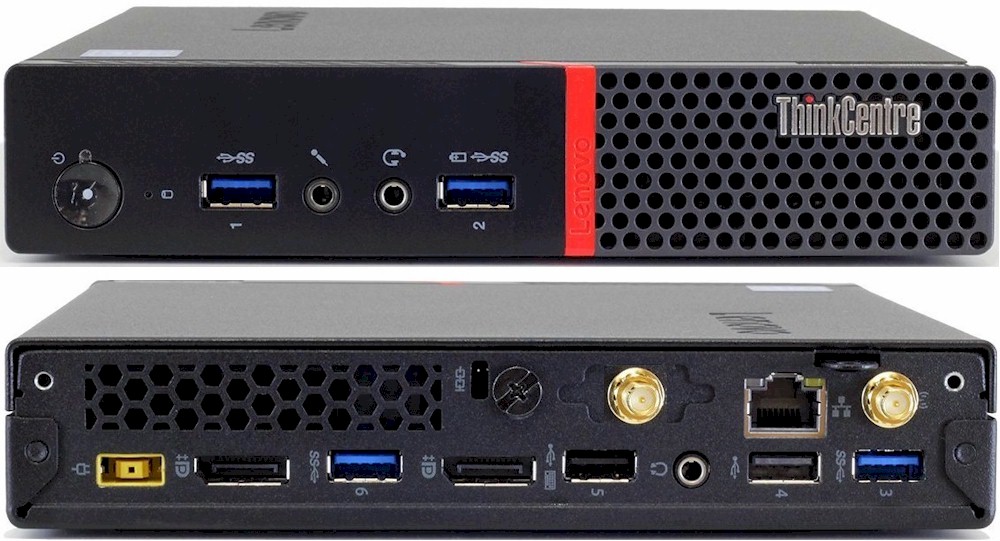
Lenovo ThinkCentre Tiny M600
We are also using octoScope’s new high-gain antennas. The increased gain will let us test a wider 5 GHz operating range by lowering total path loss by approximately 10 dB. The higher gain also works in 2.4 GHz, but this causes signal levels to be too high, potentially overloading some products. We address this by reconfiguring the test bed to use two channels of the octoScope quadAtten as fixed attenuators and two as adjustable.
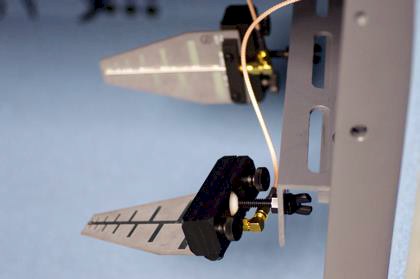
octoScope High Gain Antenna
The throughput vs. attenuation test configuration is shown below. Note only one octoBox test chamber is used.
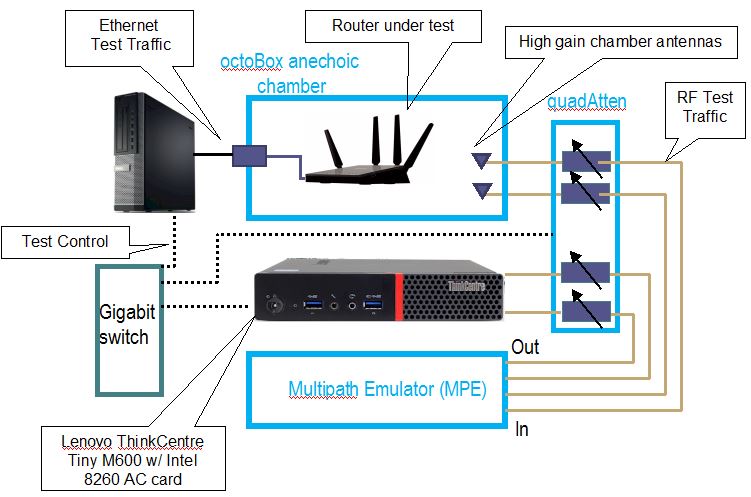
V9 configuration – Throughput vs. attenuation
We continue to use 20 MHz bandwidth in 2.4 GHz for throughput vs. attenuation testing, limiting maximum link rate to 144.4 Mbps. This is what most devices will use, given mandatory 40 MHz coexistence mechanisms and overcrowded 2.4 GHz band.
When testing 5 GHz, 80 MHz bandwidth mode will be used for a possible full maximum link rate of 866.7 Mbps with 11ac routers.
All wireless router performance testing is done on the LAN side of a router under test so that the product’s routing performance does not affect wireless performance results, i.e. the Ethernet client is connected to a router LAN port. Access points are tested using their Ethernet port.
The wireless router / AP under test (DUT) is centered on the upper test chamber turntable in both X and Y axes. If the DUT has external antennas, they are centered on the turntable. If the antennas are internal, the router body is centered. Distance from center of turntable to chamber antennas is 18 inches (45.72 cm).
Initial orientation (0°) is with the DUT front facing the chamber antennas. The photo below shows the 0° starting position for a NETGEAR R7800 Nighthawk X4S router.
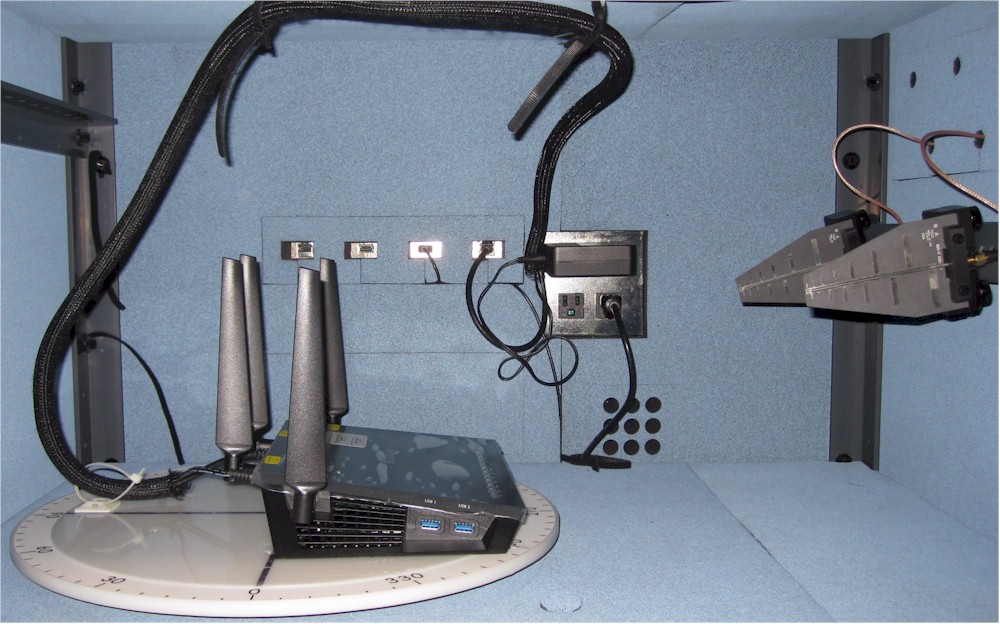
NETGEAR R7800 in Upper Test Chamber – "0 degree" Position
The router or AP under test is prepared as follows:
- Check / update latest firmware
- Reset router to defaults
- Change router settings:
- LAN IP: 192.168.1.1
- 2.4 GHz: Channel 6, Bandwidth: 20 MHz, Security: WPA2 / AES, Key: 11111111
- 5 GHz: Channel 40, Bandwidth: Auto or 80 MHz, Security: WPA2 / AES, Key: 11111111
Note we have changed from upper band Channel 153 to lower band Channel 40 for 5 GHz band testing. The FCC now allows the same transmit power in both bands and the lower channel gives us a bit lower path loss from the octoScope MPE. 10 dB of fixed additional attenuation is used for 2.4 GHz band tests. No additional attenuation is used for 5 GHz testing.
Throughput vs. Attenuation Test Process
Note: "Downlink" means data flows from router to client device. "Uplink" means data flows from client device to router.
The general test process is as follows:
- Associate client. Record connection link rate.
- Run IxChariot manual test to check throughput
- Run test script
- Power cycle DUT and repeat steps 4-6
Two test runs are made in each band for dual-band devices.
Testing is controlled by a Tcl script supplied by octoScope. The script executes the following test plan:
- Move the turntable to starting position. This places the DUT at the "0 degree" starting position previously described.
- Program the attenuators to 0 dB
- Move the turntable to -180° (counter-clockwise)
- Start 90 second IxChariot test (throughput.scr with 5,000,000 Byte test file size) simultaneous up and downlink (0 dB only)
- Wait 30 seconds, then start turntable rotation to +180° at 1 RPM.
- Wait for test to finish
- Discard first 30 seconds of IxChariot data, calculate average of remaining data and save to CSV file. Save entire IxChariot.tst file.
- Repeat Steps 3 to 7 for downlink only (DUT to STA)
- Repeat Steps 3 to 7 for uplink only (STA to DUT)
- Increase attenuators by 3 dB.
- Repeat Steps 3 to 9 until attenuation reaches 45 dB for 5 GHz test; 63 dB for 2.4 GHz test.
We continue to use the throughput.scr IxChariot script instead of the High_Performance_Throughput.scr script used by many product vendors.
We found in testing that using the throughput script and adjusting the file size upward actually produced slightly higher throughput than the high performance script.
The CSV files from the two test runs are merged into a single Excel file and the average of the two runs calculated. The average of the two runs is the value entered into the Charts database.
Throughput vs. Attenuation Test Notes
Moving the DUT through an entire 360° while the IxChariot test is running removes any orientation bias from the test and eliminates the need to determine the "best" run out of multiple fixed-position tests. Because throughput typically varies during the test run, the averaged result tends to be lower. Rotation at lower signal levels, particularly in 5 GHz, frequently causes the connection to be dropped sooner than if the DUT were stationary.
The IxChariot plot below shows a typical test run. The first 30 seconds of the run include a throughput step-up that is caused by an IxChariot artifact and does not reflect true device performance. The first 30 seconds also provides time for DUT rate adaptation algorithms to settle. For both reasons, the test script excludes the first 30 seconds of data in the average value saved in the Charts database.
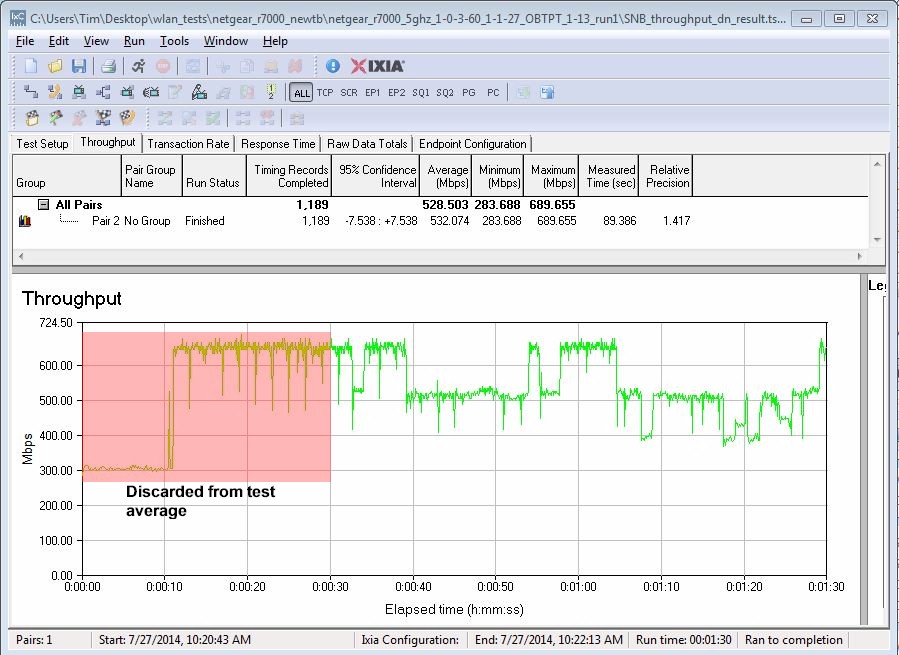
IxChariot Test Data detail
Maximum Wireless Throughput Test Configuration
The V8 process AC1900 test client was unable to test maximum throughput of 4×4 products. So we had to resort to using pairs of routers, which makes fair relative comparison impossible. We’re addressing this in the new process by using the VeriWave system to test maximum throughput for all products.
We use an Ixia VeriWave WaveTest 20 three slot chassis loaded with RF46014 WaveBlade Wi-Fi, WBE1604 WaveBlade Ethernet and Management modules. This is the same configuration used for MU-MIMO testing.
The Wi-Fi blade acts as the Wi-Fi device (STA), supporting 802.11a/b/g/n/ac. It has four RF ports, and can emulate any STA from 802.11b 1 Mbps to 4×4 802.11ac MU-MIMO 1733 Mbps. The Wi-Fi blade can create up to 500 fully independent stateful clients.
The Management blade is the controller for the two instrumentation blades, allowing the chassis to sit on a LAN and be accessed via a web interface for simple management chores. The Ethernet blade is a quad-port Gigabit wire-speed traffic generator with full packet-capture capability. The VeriWave’s 4×4 capability supports testing maximum throughput for 802.11a/b/g/n and ac standards including 256-QAM, i.e. (AC2350 / 2400, AC2600, AC5200).
The test setup is shown below. An octoScope quadAtten is used between the Veriwave Wi-Fi blade and octoScope chamber antennas. It is set to a 20 dB fixed attenuation to ensure signal levels don’t exceed the Veriwave’s maximum input level of -25 dBm.
Note we are using 40 MHz bandwidth mode for 2.4 GHz tests. 2.4 GHz testing also does not use 256-QAM because it is not part of the 802.11n standard. The Veriwave supports only HT MCS rates 0-31 for 802.11n testing. So maximum 2.4 GHz link rate used for 4×4 devices is 600 Mbps.
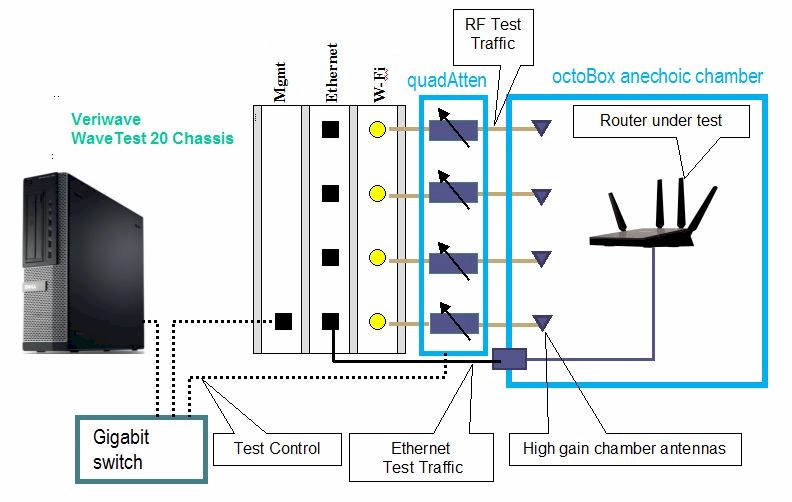
V9 configuration – Maximum wireless throughput
The router or AP under test is prepared as follows:
- Check / update latest firmware
- Reset router to defaults
- Change settings:
- LAN IP: 192.168.1.1
- 2.4 GHz: Channel 6, Bandwidth: 40 MHz, Security: WPA2 / AES, Key: 11111111
- 5 GHz: Channel 40, Bandwidth: Auto or 80 MHz, Security: WPA2 / AES, Key: 11111111
The VeriWave WaveBlade is configured to match these properties of the router / AP under test for each band:
- Number of spatial streams: 1 – 4
- Signal bandwidth: 20, 40, 80 MHz
- VHT MCS Index: 0 – 9 for 5 GHz 802.11ac
- HT MCS Index 0-31 for 2.4 GHz 802.11n
- Short Guard interval
MIMO channel models (A-F) are not used; bypass mode is set. Example settings:
- AC2600 5 GHz: 4 spatial streams, 80 MHz bandwidth, VHT MCS 9 (1733 Mbps PHY rate)
- AC2600 2.4 GHz: 4 spatial streams, 40 MHz bandwidth, VHT MCS 31 (600 Mbps PHY rate)
- AC1900 5 GHz: 3 spatial streams, 80 MHz bandwidth, HT MCS 9 (1300 Mbps PHY rate)
- AC1900 2.4 GHz: 3 spatial streams, 40 MHz bandwidth, HT MCS 23 (450 Mbps PHY rate)
- AC1750 5 GHz: 3 spatial streams, 80 MHz bandwidth, HT MCS 9 (1300 Mbps PHY rate)
- AC1750 2.4 GHz: 3 spatial streams, 40 MHz bandwidth, HT MCS 23 (450 Mbps PHY rate)
20dB of fixed attenuation is set between router under test and the Veriwave.
Maximum Wireless Throughput Test Process
The following test process is run for 2.4 and 5 GHz, uplink and downlink:
- The Veriwave is configured to match the router / AP under test and associated. MCS rates are set to maximum for the router class.
- A TCP Goodput test with four simultaneous TCP/IP sessions is run for 30 seconds with MSS, Window and Frame size set so the Gigabit link is fully loaded.
- The MCS rate is lowered by 1 and the TCP Goodput test run again. If the throughput improves, the lower MCS rate is used. Otherwise, the maximum MCS rate is used.
- TCP Goodput is run with four simultaneous TCP/IP sessions for 60 seconds, repeated 10 times, with 5 second pause between test runs. The average of of all 10 runs is entered into the Charts database.
