Introduction
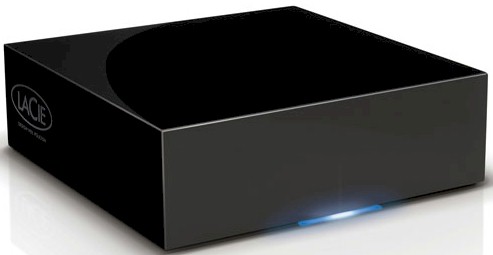
| At a Glance | |
|---|---|
| Product | LaCie Cloudbox [Website] |
| Summary | 100 GB network storage device with automatic backup to cloud storage |
| Pros | • Gigabit LAN port • One year of 100 GB storage included • Easy setup • Windows and MacOS client backup included |
| Cons | • Slow as a NAS • Relatively small capacity • Backup apps don’t support recovery imaging |
With many NASes now including some sort of “cloud” feature, it’s very difficult for a manufacturer to find a way to differentiate a new product. But most NASes merely allow you to remotely access your device from anywhere on the Internet. The CloudBox from LaCie takes a completely different approach.
Rather than being a traditional NAS, it’s better to think of the CloudBox as an Ethernet-connected disk. While the CloudBox offers only 100 GB of storage, all of it is backed up to secure online storage. A one year subscription to 100 GB of online storage is included in the $189.99 (list) CloudBox purchase price. After the first year, it will cost you $129 (99 Euro) per year.
Using supplied backup software (MacOS and Windows versions included), you can decide which files to backup to the CloudBox. Then, once per day, the CloudBox synchronizes all of its files to an online storage site. You have the option of restoring files to your computer either from the CloudBox, or in the event the CloudBox is stolen or damaged, from online storage.
The CloudBox looks like many of LaCie’s other products designed by Neil Poulton. It’s a simple black box with a single, multi-colored bottom-mounted LED that shows status and activity. Figure 1 shows a chart detailing LED behavior. The back panel has a power button, a power supply jack, and a single Gigabit Ethernet port.
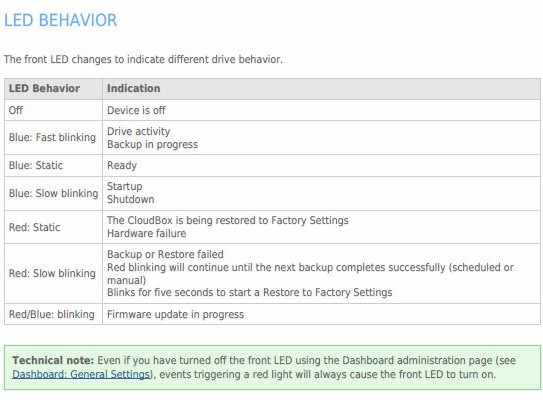
Figure 1: Chart depicting LED Behavior
Note that even though the drive capacity is 250 GB, only 100 GB is available to you. Note also the tiny fan, which was inaudible.
Inside
The CloudBox is powered by a Marvell Kirkwood 88E6192 running at 800 MHz. The Gigabit Ethernet controller is a Marvell 88E1318, and the device has 1 GB of memory. Figure 2 shows the interior with the Samsung Spinpoint M7 250 GB 2.5" SATA 5400 RPM hard drive removed.
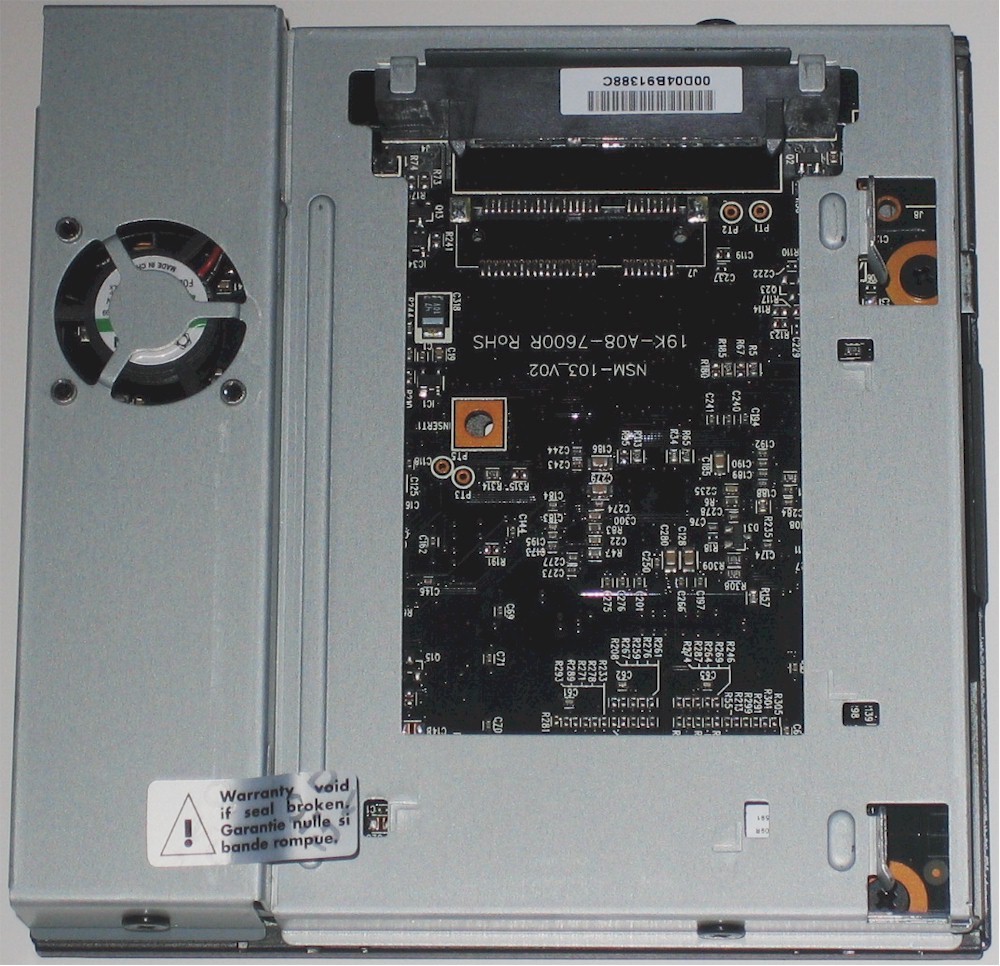
Figure 2: Interior of the CloudBox with hard drive removed
Setup
The CloudBox is designed to be a simple to set up and simple to use. A printed, well-illustrated Quick Install Guide guides you through the process. While most people won’t bother reading a user manual, it’s well worth reading the Quick Install Guide. There are several important tips included:
- You must have internet access to complete the setup wizard.
- The CloudBox won’t be available to use until you’ve finished setting up the device and your online account has been activated.
- The administrator login and password cannot be recovered.
To set up the CloudBox, you can either use the LaCie Network Assistant, (MacOS and Windows versions included on the CD), or you can type http://cloudbox or http://cloudbox.local into your web browser. I tried the browser method first, and name resolution failed to resolve the IP address of the device. I then installed the Network Assistant software from the CD included with the product. Figure 3 shows the Network Assistant icon in the system tray.
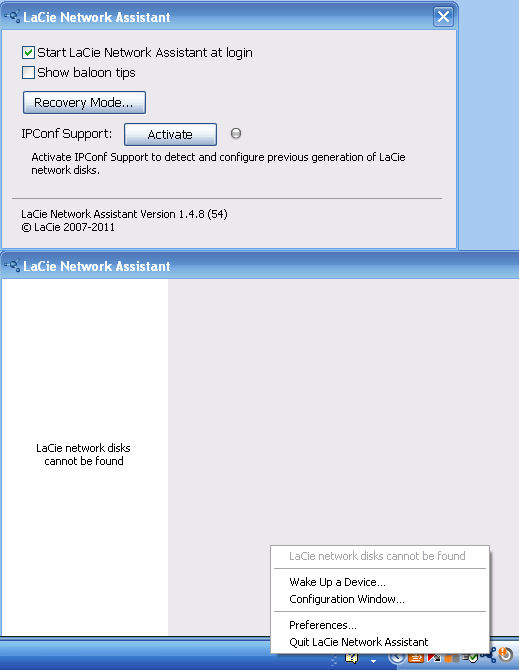
Figure 3: Lacie Network Assistant initially didn’t find the CloudBox
Initially, the Network Assistant didn’t discover the CloudBox, either. However, I checked the preferences and activated IPConf support, shown in Figure 4, and the Network Assistant found not only the CloudBox, but also another NAS (Seagate GoFlex) that was active on my network.
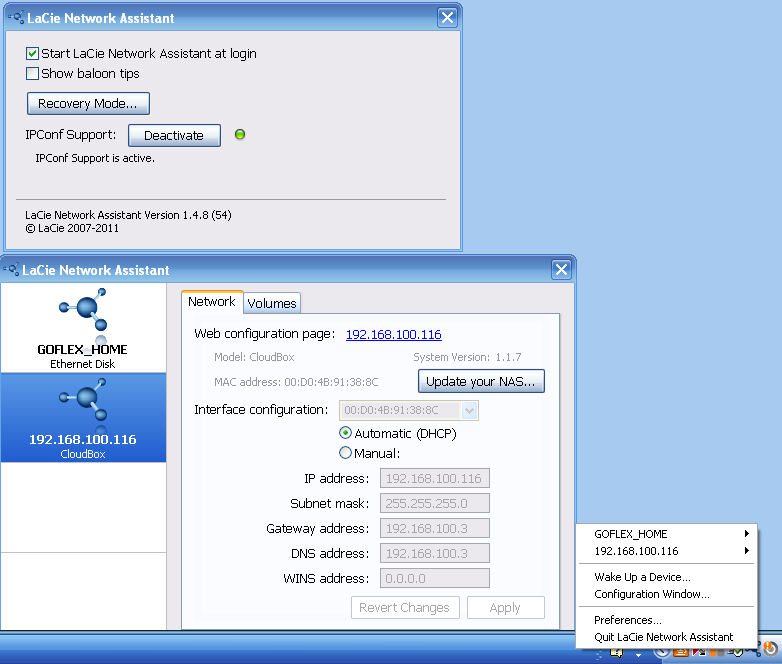
Figure 4: Network Assistant found the CloudBox after enabling IPConf
When I told LaCie about this, they said that the ClouBox attempts to discover the device via Bonjour and that IPConf (a method of discovering older LaCie devices) should not have made a difference. Perhaps I didn’t wait long enough for discovery, so your mileage may vary.
The first time you click on the web configuration page link shown in Figure 3, you are taken a web-based setup wizard. First, you enter your preferred language and time zone. Then, the CloudBox will check for updated firmware, and if available, install it.
Next, you enter the 16 digit contract number supplied on a printed card. This will activate your one year subscription for online backup services. Then you enter a user name and password along with your email address as shown in Figure 5.
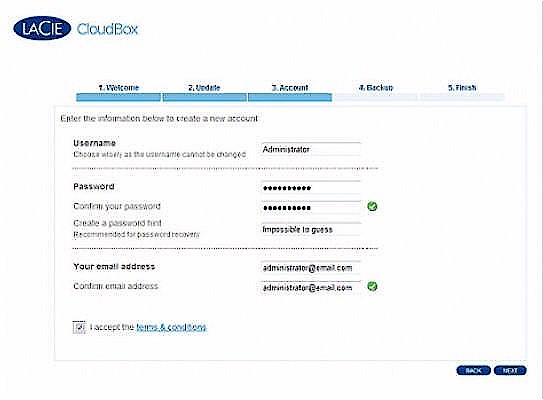
Figure 5: Account setup dialog screen
The name and password you enter here is becomes administrator account. You must remember these credentials, because the password cannot be recovered. Finally you enter the verification code that LaCie emails to the address you specified.
Menu Tour
Once the configuration is complete, you can log into the browser-based dashboard shown in Figure 6. As you can see, the interface is clean and simple with only six submenus.
The Home page shows the status of your backup, how much space you’ve used, when your license expires and summary information for the other five menus. To navigate to the other submenus, you merely click on them. Alternatively, you can drag the large icon into the center of the screen – a feature we’ve seen on other LaCie products.
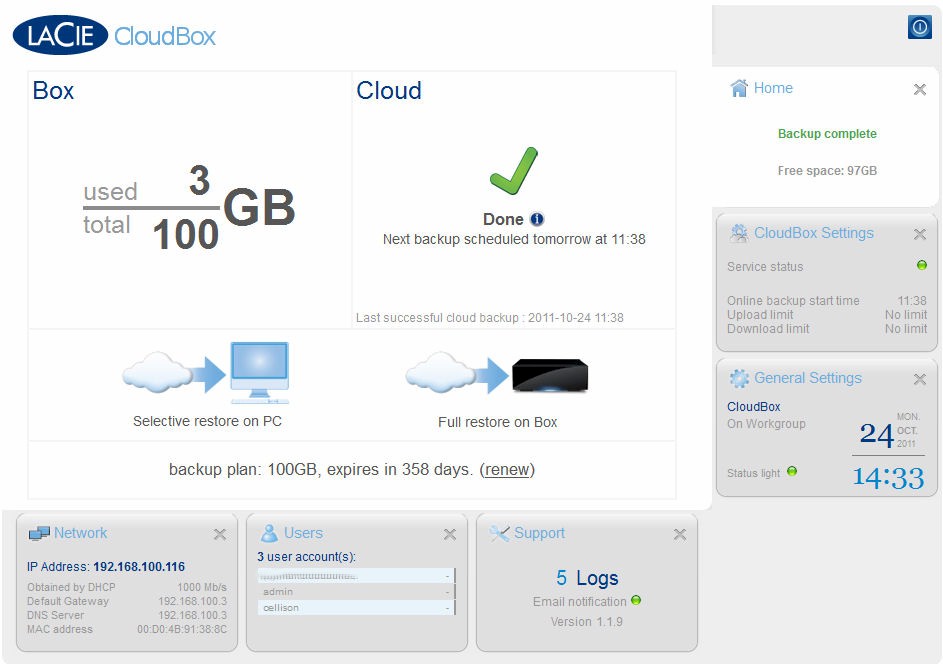
Figure 6: Dashboard Home
Note: this screen shot was taken after I had configured the CloudBox and it had been online for 4 days.
Here are the highlights of the other five menus.
CloudBox Settings – This menu provides a summary of general settings such as user name, account expiration date, account email address. Under Backup settings, you can set upload and download speed limits and initiate an online backup immediately.
The CloudBox also measures your internet connection speed and provides you with an estimate of how much data you can upload per day.For my cable connection, the estimate is 7.0 GB/day.
For me, the most interesting part of the settings menu is the History tab, shown in Figure 7. It shows the start and end time for each online backup session as well as the total amount of data synchronized.
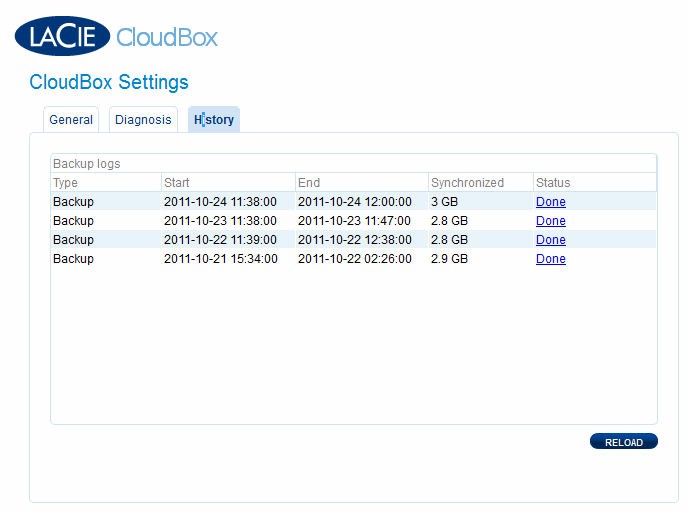
Figure 7: Settings> History tab
If you click on the Done link, you get a session summary as shown in Figure 8. The summary information is the extent of the data. You don’t get a complete file listing of files backed up.
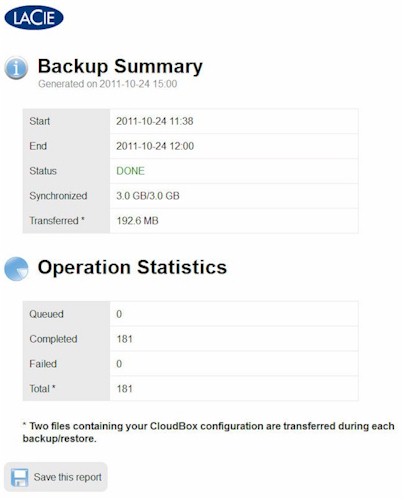
Figure 8: Backup summary
General Settings – This menu shows the machine name, workgroup, language, time, date and time zone. You also have the option of disabling the status light.
Support – Here you’ll find the current version of firmware running on your CloudBox and the auto-update status. Under the Log window, you’ll see the end time for the most recent backups along with the last firmware update as shown in Figure 9. If you download the System log and unzip it, you’ll find all of the log files you’d normally find on a Linux system in the /etc and /var directories.
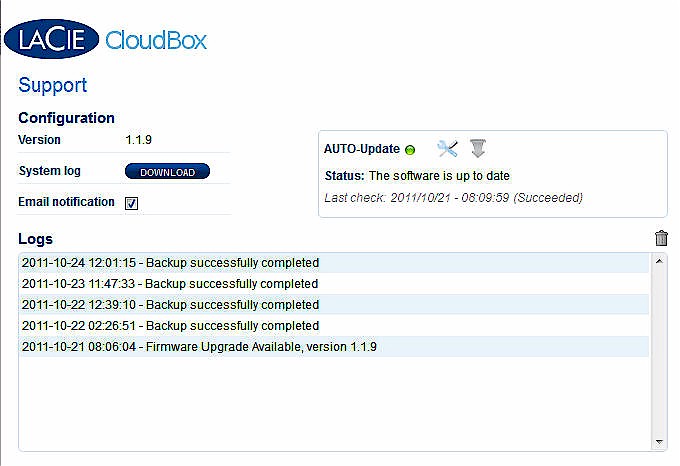
Figure 9: Dashboard Support page
Users – In this menu, you can create and edit users. For each user, you can set a quota. As you create a user, a private share is created using the user’s login name. (eg, admin). Note, however, that only the original account name has administrator rights.
Network – This menu lets you manually configure the IP address configuration, and enable the use of a proxy server.
Hands On
To use the CloudBox, you merely use it as you would any other shared network device. In Windows, you can use Tools > Map network drive to map your share to a drive letter. On a Mac, you can use the Go menu connect to server (Command K) or Network (Shift-Command K) to find and mount your share. You can also use the LaCie Network Assistant to find and map volumes.
You can then move/copy files to the CloudBox as you would for any other shared network storage device using Windows Explorer or MacOS Finder. Any files you place on the CloudBox will automatically be backed up to your CloudBox online storage account on the next daily cycle.
Virtually any backup program that can write files to a network drive can also be used to back up computers to the CloudBox. In order to facilitate backup, the CloudBox ships with backup software for both MacOS and Windows.
For the MacOS, LaCie includes the fully-featured Intego Backup Manager Pro. For Windows, the software included is the free version of Genie Timeline. The free version is a de-featured version of the Genie Timeline Home and Pro versions, also available on the LaCie website.
For reference, this chart compares the bundled free version with the features of the $39.95 Home version and the $59.95 Pro version. The major important features missing in the free version include Smart Disaster recovery features, compression, and automatic purging of files to save space. Since I recently had to restore a system from a disaster recovery “image”, I certainly realize the value of disaster recovery capabilities.
Genie Timeline
Genie Timeline has a very simple, intuitive interface. When you first launch Genie Timeline, you land at a page to select the files that you want to back up shown in Figure 10. Here you have the option of choosing from preselected categories of files to back up.
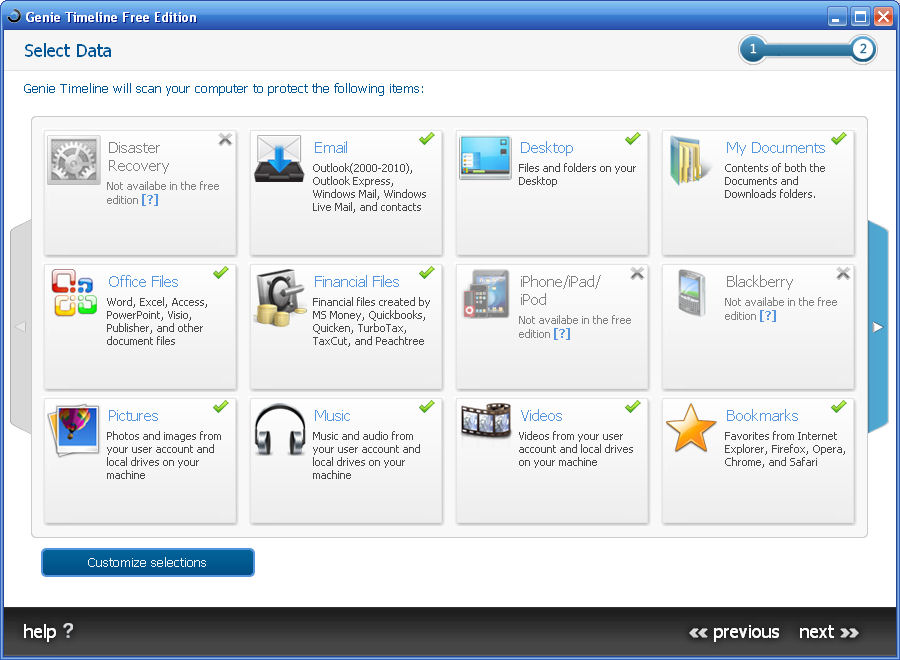
Figure 10: Genie Category file selection
Alternatively, you can choose to select files and directories to back up from a Windows Explorer-like screen shown in Figure 11.
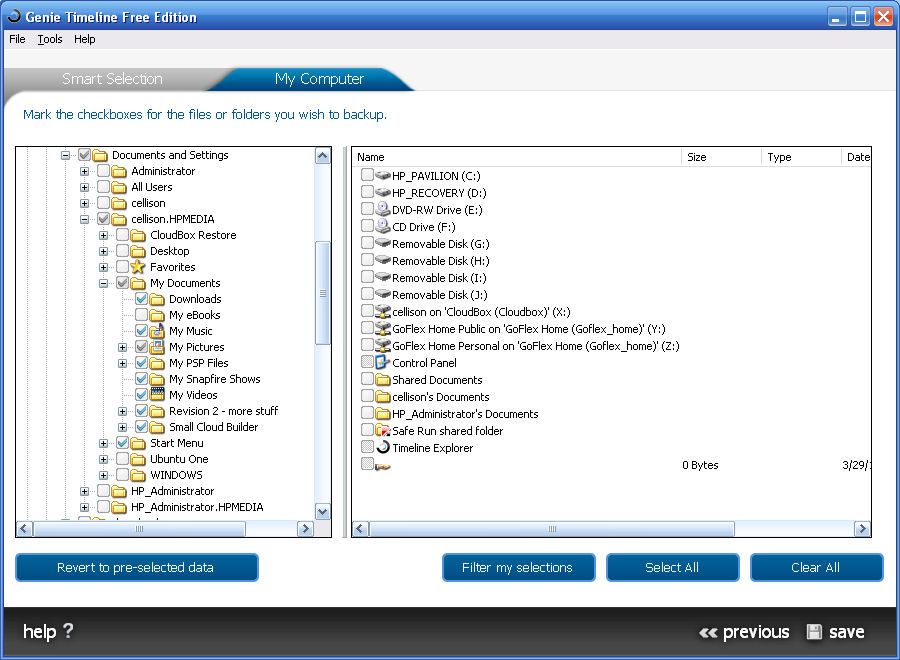
Figure 11: Genie Explorer-style selection
Next, you select a backup destination shown in Figure 12. I selected drive X:, the drive mapped to the cellison share on the CloudBox.
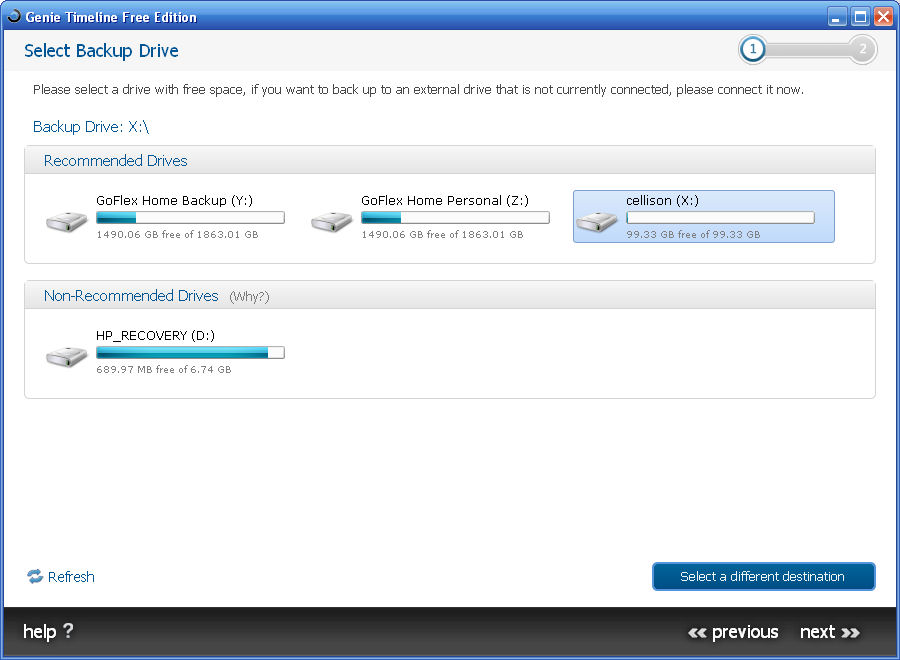
Figure 12: Genie backup destination selection
That’s all there is to setting up your basic backup scheme. Genie Timeline constantly monitors the folders or the smart selection items for changes and queues them for backup. By default, the backup runs once/hour, but through the Genie dashboard, Figure 13, you can force a backup to “Run Now”.
The Dashboard also lets you restore from the Timeline interface, change data backup selections, change the backup destination and configure email notifications. If you click on an unsupported feature, such as disaster recovery, the “?” following Backup Info, or Advanced settings, you are taken to a web site where you are offered the opportunity to purchase the Pro version.
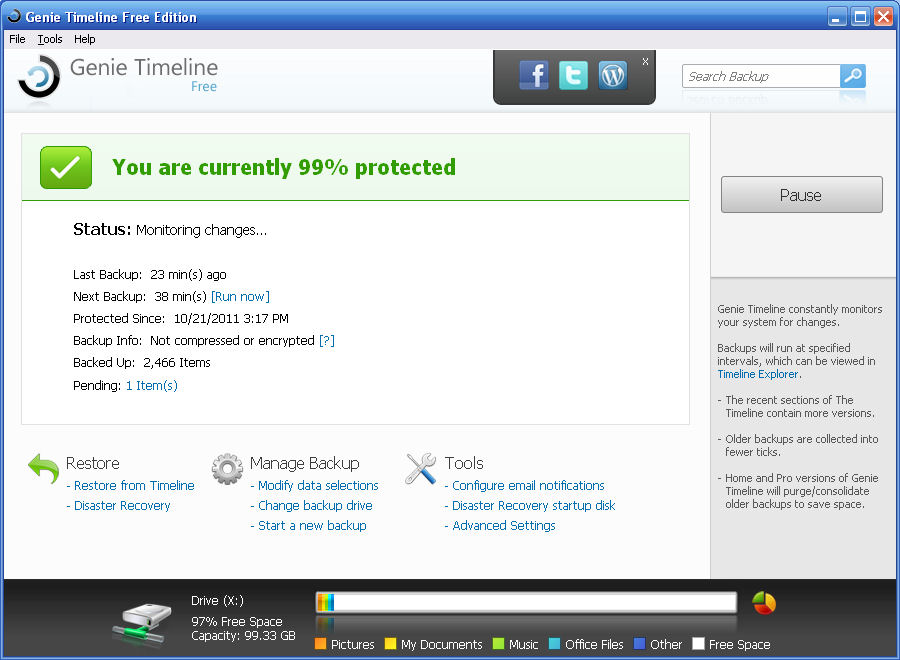
Figure 13: Genie Timeline Dashboard
The restore features of the free version of Genie Timeline are fairly basic. Restoration is done from the Genie Timeline Explorer shown in Figure 14.
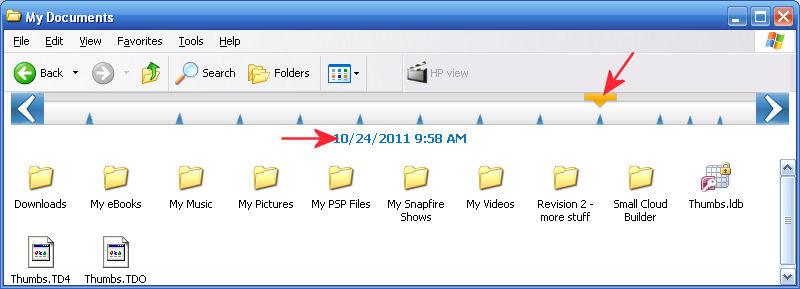
Figure 14: Genie Timeline Explorer
The ticks across the top of the screen, pointed out by the red arrow that I added, correspond to the last 10 backup points. During the backup process, Genie will copy small files in their entirety, and for large files, will do block level incremental backups. The block level incremental backup is ideal for files such as Outlook.PST mail files. Genie also uses Microsoft’s Volume Shadow Services to backup open files.
Genie Timeline also handles multiple versions of files as shown in Figure 15. It’s important to note that files deleted from the source are not deleted from the CloudBox. And, since the free version of Genie doesn’t automatically delete old revisions, you’ll have to do that manually (or upgrade).

Figure 15: File revisions are stored in the same directory as the original file
Restore
Of course, what’s really important about having cloud-based backups is the ability to restore from the cloud when needed. To restore from the cloud, you need to download and install a restore program from http://cloudbox.lacie.com. There are 32 and 64 bit versions for MacOS and Linux as well as a Windows version.
When you first install the program, you will be prompted for the administrator’s user name, password, and the 16 digit contract number. You can opt to remember the contract number, but you’ll need to log in with administrator’s credentials each time you launch the program. After logging in, you will see the simple screen shown in figure 16. Your only two options are Browse or Full Restore.
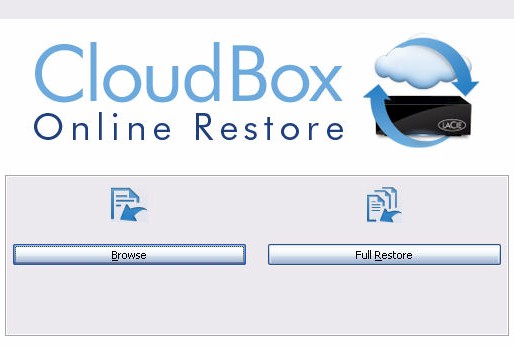
Figure 16: CloudBox Online Restore options
When you select browse, you first select from one of the ten last successful backup points. Using an Explorer-like interface, you first select the files or directories you want to restore. Then you choose the destination location for the restored files. You can restore directly to the CloudBox or to your computer. Figure 17 shows the selective restore interface.
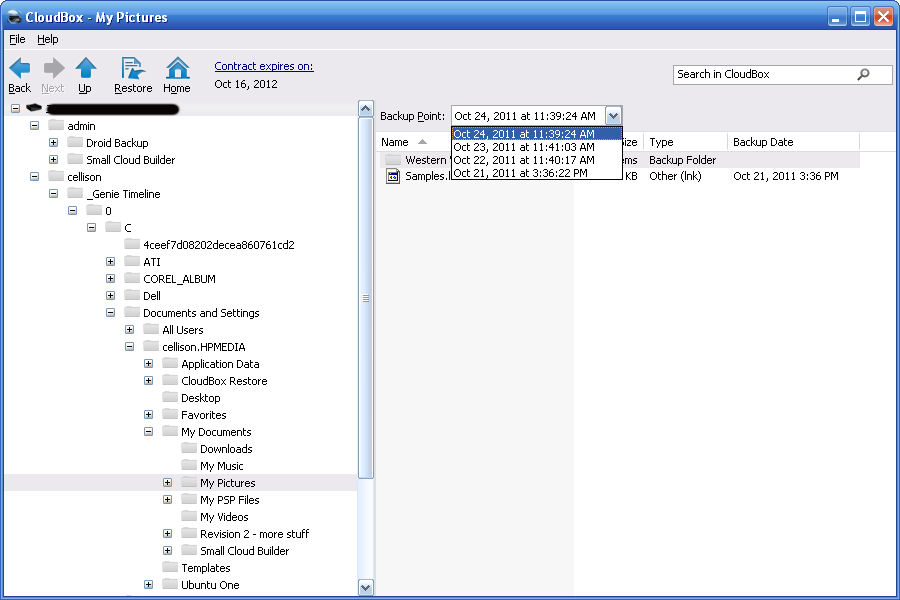
Figure 17: Selective restore from Online Storage
While your selected files are being restored from your online storage, a status box keeps you informed of the progress along with an estimate of time remaining as shown in Figure 18.
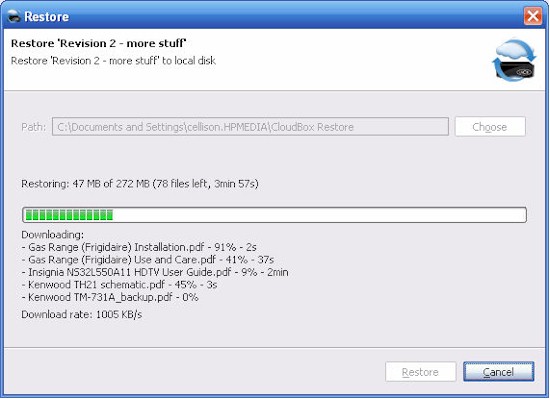
Figure 18: Online restore status page
If you have to replace your CloudBox for any reason, you’ll need to do a Full Restore. You can launch the full restore either from the Online Restore application, or from the Dashboard (Figure 5 above).
All data on your existing CloudBox will be deleted and replaced by the Full Restore. However, you also have the option of selecting your computer as the destination for the Full Restore. Of course, depending on the amount of data stored online and your internet connection speed, a full restore could take several days to complete.
Performance
If you compare the performance of the CloudBox to other single-drive NASes, you’ll find that it ranks near the bottom. The file write performance Chart over on SmallNetBuilder shows the CloudBox ranking 10th out of 13 as shown in Figure 19 with only 19 MB/s of throughput.
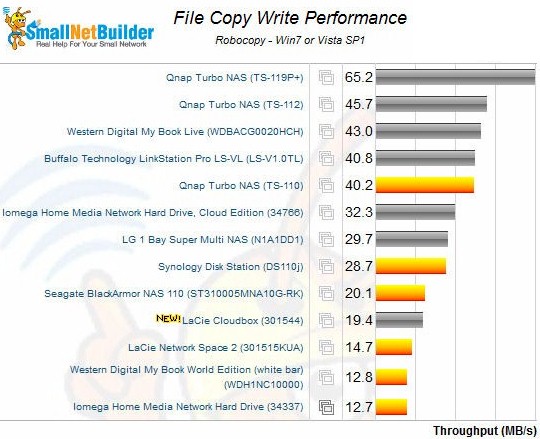
Figure 19: File Copy Write Performance of single drive NAS devices
For read performance the CloudBox was slightly faster at 27 MB/s, but still ranked last among single drive NASes (Figure 20).
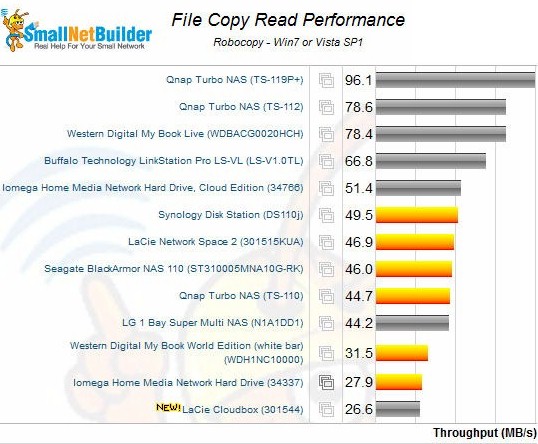
Figure 20: File Copy Read Performance of single drive NAS devices
While the performance is somewhat disappointing, you have to remember that the primary purpose of this device is for backups. Since the backup software runs in the background, performance is probably less of an issue than if you were using it to move large amounts of data between devices.
As noted in several places in the CloudBox manual, synching to the cloud can take many hours or days depending on the speed of your internet connection. My service provider is Comcast Cable, and when I periodically test the connection speed, I get fairly good results. Figure 21 shows that my download speed is a little over 31 Mbps and upstream is 5.8 Mbps.

Figure 21: Cable connection performance
My initial synchronization of the CloudBox with online storage was about 2.9 GB and took 10 hours and 58 minutes. That equates to just a little less than 600 Kbps upstream—about 10% of my measured speed. On another test, the CloudBox uploaded 192.6 MB to the cloud in 22 minutes—slightly over 1 Mbps.
On download restore tests, of course the performance was much better. I restored 259 MB of files in 3 minutes and 23 seconds, and 173 MB of files in 2 minutes and 18 seconds. These both work out to around 10 Mbps. Although better than upload, this is still only about 33% of my available download bandwidth.
Closing Thoughts
The LaCie CloudBox was designed to be a simple-to-use backup device that provides both local and cloud-based storage. The magic is in its simplicity, i.e. anything that you put onto the CloudBox gets backed up online. While the CloudBox ships with backup software for both MacOS and Windows, you can use whatever backup or synchronization software you prefer.
While I applaud LaCie for including the fully-featured Intego Backup Manager Pro for the Mac, I wish that they had included at least the Home version of Genie Timeline. The included free version of Genie Timeline lacks the ability to create a recovery image – a “must have” feature in my book.
It would be a mistake to think of the CloudBox as a typical NAS. While it does support multiple users with separate shares, it lacks UPnP AV/DLNA/iTunes media servers. It also lacks remote access, though arguably you could retrieve any files you need from the online backup.
My initial impression was that a network storage device with only 100 GB of space would be of limited use. I have several TB of storage locally and the disaster recovery image for my computer is over 400 GB. But clearly, this device wasn’t designed for the enthusiast market, but rather for the typical home user who doesn’t have a huge video, photo or music library.
At around $180 street, the CloudBox doesn’t look like a very good deal for 100 GB of storage until you realize that the price includes a one year subscription to 100 GB of online storage. That makes it a pretty good bargain. As a comparison, 100 GB of online storage at Dropbox costs $19.99/month or $199 per year. SugarSync, another online storage and synchronization vendor, charges $149/year for 100 GB.
Once your first year is up, however, the CloudBox starts looking less attractive at its $129/year renewal price. And when you consider that you can get ulimited storage from a vendor like Backblaze for under $50/year from your own Windows or MacOS machine, you might wonder why you’d buy the CloudBox at all!
The Lacie CloudBox is a simple appliance that can automatically backup your important files to a network storage device, which is then automatically synchronized to offsite cloud-based storage. With this solution in place, you have both onsite and offsite secure backup of your files. If that simplicity appeals to you, you can live with the 100 GB limitation and don’t mind paying a premium price for cloud storage, the LaCie CloudBox could be the perfect backup solution for you.
